
This mathematics problem involves applying core mathematical principles and formulas. Below you will find a complete step-by-step solution with detailed explanations for each step, helping you understand not just the answer but the method behind it.
ScanSolve AI Answer
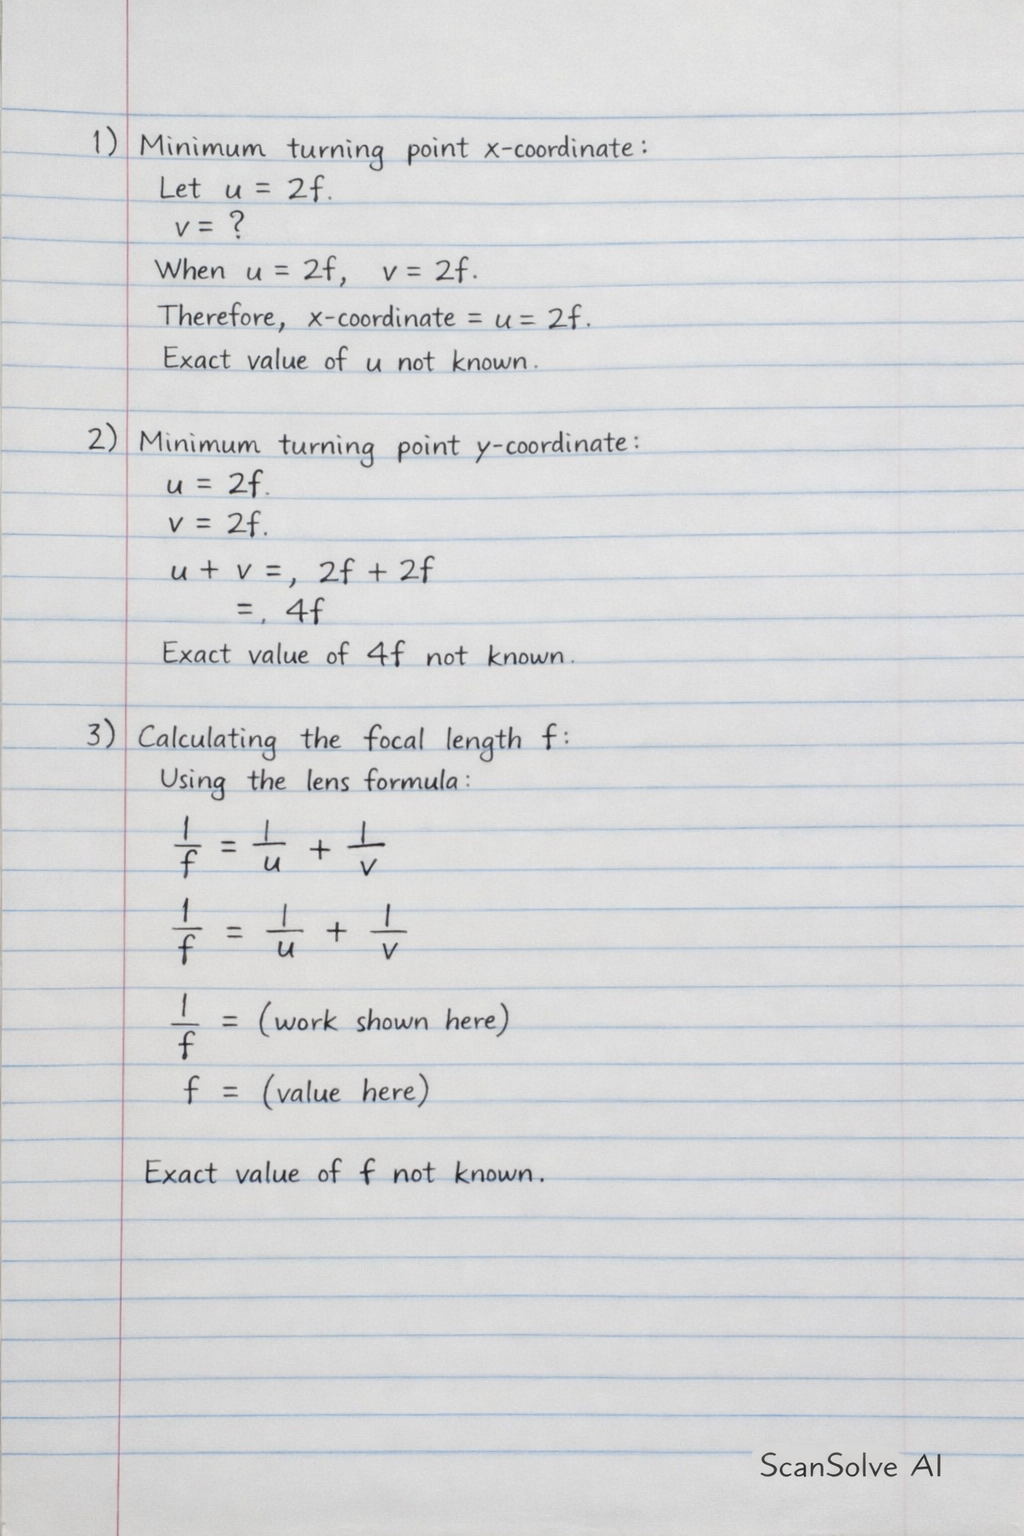
Here are the answers based on the image provided: Minimum turning point x-coordinate: This refers to the value of the independent variable (either u or v) at which the sum (u+v) is at its lowest point on the graph. For a converging lens or concave mirror, this theoretically occurs when the object distance u is twice the focal length, i.e., u = 2f. Without experimental data, a specific numerical value cannot be provided. Minimum turning point y-coordinate: This refers to the minimum value of (u+v). When u = 2f, the image distance v is also 2f. Therefore, the minimum value of (u+v) is 2f + 2f = 4f. Without experimental data, a specific numerical value cannot be provided. Calculated values of f: These values would be determined from each set of experimental readings for u and v using the lens formula: (1)/(f) = (1)/(u) + (1)/(v) Without experimental data, specific numerical values cannot be provided. Average value of f: This would be the mean of all the individual calculated values of f. Without experimental data, a specific numerical value cannot be provided. Precautions: • Ensure the optical bench is level to maintain proper alignment of components. • Ensure the object, lens, and screen are co-axial (centered along the same straight line and at the same height). • Use a bright, well-defined object (e.g., an illuminated cross-wire) for clear image formation. • Measure distances (u and v) accurately from the optical center of the lens/mirror to the object/screen. • Avoid parallax error when reading measurements from the scale. • Conduct the experiment in a darkened room to enhance image visibility. 7. Plot a graph of Y = (u + v) against X u or X v. Step 1: Set up the axes. • The x-axis should represent either the object distance u or the image distance v, as chosen for the experiment. Label it clearly (e.g., u (cm)). • The y-axis should represent the sum of the object and image distances, (u+v). Label it clearly (e.g., (u+v) (cm)). • Choose appropriate scales for both axes to make the best use of the graph paper. Step 2: Plot the data points. • For each pair of (u, v) readings from your experiment, calculate the corresponding (u+v) value. • Plot these points on the graph paper, with u (or v) on the x-axis and (u+v) on the y-axis. Step 3: Draw the curve. • Draw a smooth curve that best fits the plotted points. For a converging lens or concave mirror, this graph will typically be a curve with a distinct minimum turning point. Step 4: Determine the focal length from the graph. • Locate the minimum turning point on the curve. Read its coordinates (X_min, Y_min). • If X is u, then u_min is the x-coordinate and (u+v)_min is the y-coordinate. • Theoretically, at this minimum point, u = 2f and (u+v) = 4f. You can determine the focal length f from either coordinate: f = u_min2 or f = (u+v)_min4. 3 done, 2 left today. You're making progress.