
This biology question covers important biological concepts and processes. The step-by-step explanation below helps you understand the underlying mechanisms and reasoning.
ScanSolve AI Answer
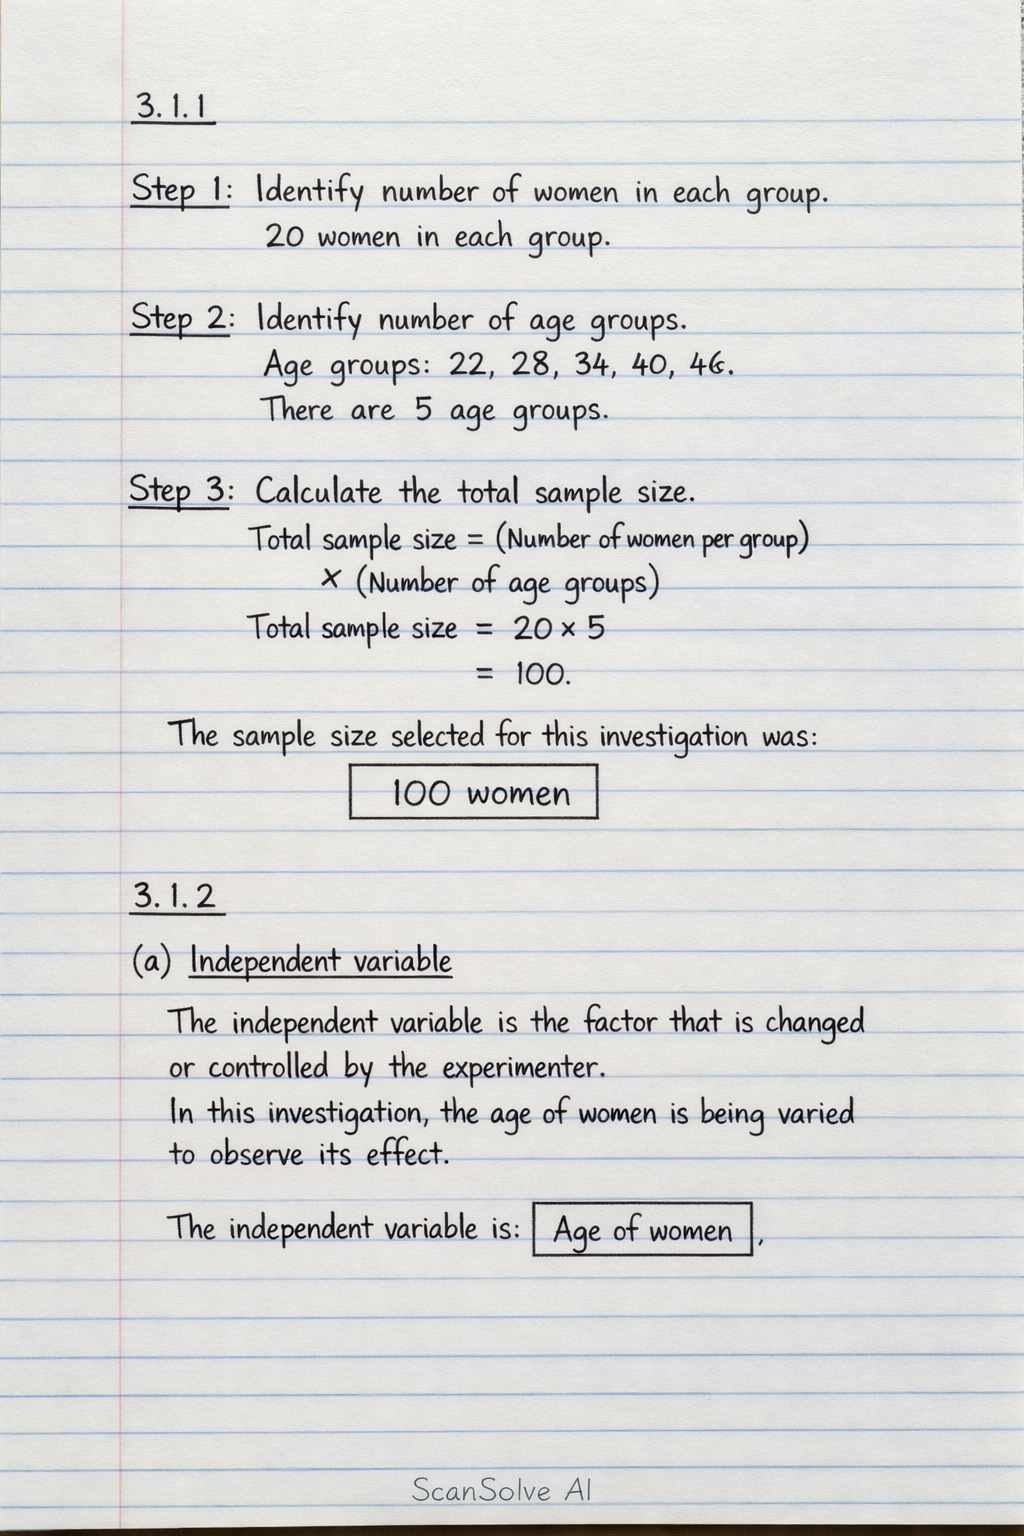
Here are the solutions to the questions: 3.1.1 Step 1: Identify the number of women in each group. The text states: "A group of 20 women from each age group... were selected randomly." Step 2: Identify the number of age groups. From the graph, the age groups are 22, 28, 34, 40, and 46. There are 5 age groups. Step 3: Calculate the total sample size. Total sample size = (Number of women per group) × (Number of age groups) Total sample size = 20 × 5 = 100 The sample size selected for this investigation was 100 women. 3.1.2 a) Independent variable The independent variable is the factor that is changed or controlled by the experimenter. In this investigation, the age of women is being varied to observe its effect. The independent variable is Age of women. b) Dependent variable The dependent variable is the factor that is measured or observed in response to changes in the independent variable. Here, the chances or incidence of miscarriages are being measured. The dependent variable is Chances of miscarriages (or Incidence of miscarriages). 3.1.3 Step 1: Observe the data in the bar graph. As the age of women increases (from 22 to 46), the incidence of miscarriages also increases. At age 22, the incidence is 10%. At age 28, the incidence is 11%. At age 34, the incidence is 15%. At age 40, the incidence is 24%. At age 46, the incidence is 50%. Step 2: Describe the relationship. There is a positive correlation between the age of women and the chances of miscarrying. As women get older, the likelihood of them experiencing a miscarriage increases. 3.1.4 To improve the reliability of this investigation, one could: • Increase the sample size: Using a larger number of women in each age group would make the results more representative and less prone to random variation. • Repeat the investigation: Conducting the study multiple times with different samples could help confirm the consistency of the findings. • Standardize conditions: Ensure that all other factors (medical care, physical activities, social environment) are as consistent as possible across all groups to isolate the effect of age. 3.1.5 Step 1: Find the percentage of women likely to miscarry for the 46-year-old age group from the graph. For women aged 46, the incidence of miscarriages is 50%. Step 2: Determine the number of women in the 46-year-old age group. The text states: "A group of 20 women from each age group... were selected randomly." So, there are 20 women in the 46-year-old group. Step 3: Calculate the number of women likely to miscarry. Number likely to miscarry = Percentage × Total women in group Number likely to miscarry = 50\% × 20 Number likely to miscarry = (50)/(100) × 20 Number likely to miscarry = 0.50 × 20 Number likely to miscarry = 10 According to the data, 10 of the women sampled who are 46 years old are likely to miscarry. 3 done, 2 left today. You're making progress.