
This biology question covers important biological concepts and processes. The step-by-step explanation below helps you understand the underlying mechanisms and reasoning.
ScanSolve AI Answer
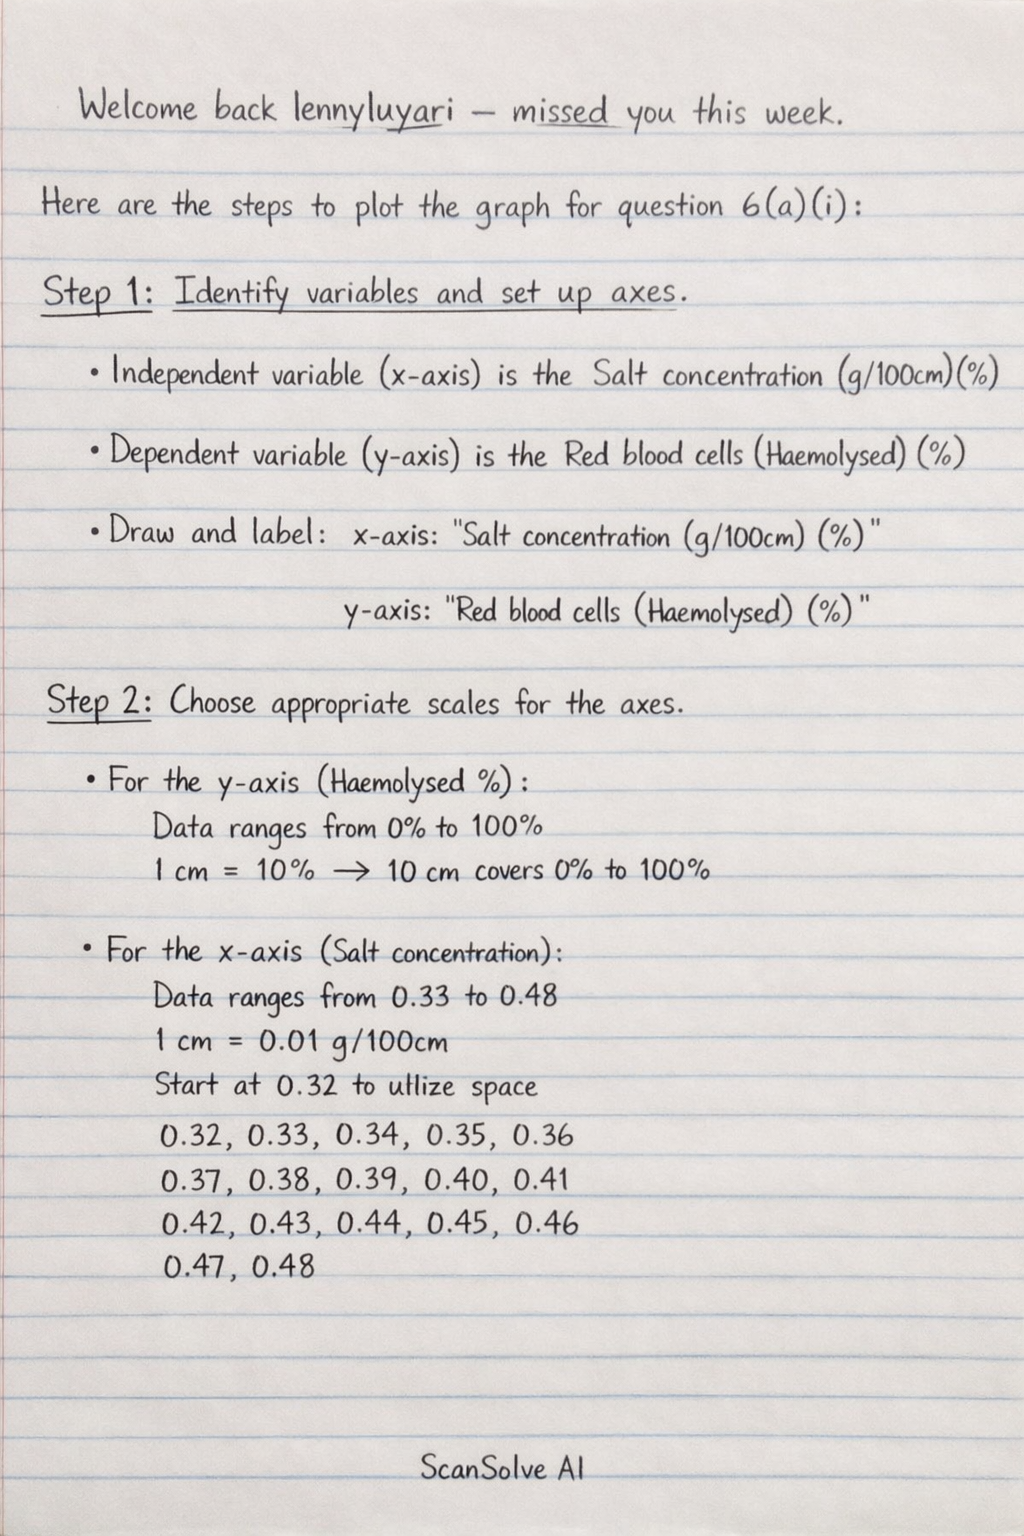
Welcome back lennyluyari — missed you this week. Here are the steps to plot the graph for question 6 (a)(i): Step 1: Identify variables and set up axes. • The independent variable (x-axis) is the Salt concentration (g/100cm) (%). • The dependent variable (y-axis) is the Red blood cells (Haemolysed) (%). • Draw and label the x-axis as "Salt concentration (g/100cm) (%)" and the y-axis as "Red blood cells (Haemolysed) (%)". Step 2: Choose appropriate scales for the axes. • For the y-axis (Haemolysed %): The data ranges from 0% to 100%. A suitable scale would be 1 cm (or 1 large square) representing 10%. This means 10 large squares will cover the full range. • For the x-axis (Salt concentration): The data ranges from 0.33 to 0.48. A suitable scale would be 1 cm (or 1 large square) representing 0.01 g/100cm. Start the x-axis at a value like 0.30 or 0.32 to utilize the graph paper effectively. Step 3: Plot the data points. • Plot each pair of (Salt concentration, Haemolysed %) values from the table onto your graph: • (0.33, 100) • (0.36, 91) • (0.38, 82) • (0.39, 69) • (0.42, 30) • (0.44, 15) • (0.48, 0) Step 4: Draw the curve. • Draw a smooth curve of best fit through the plotted points. Do not connect the points with straight lines; aim for a continuous, flowing curve that best represents the trend of the data. Send me the next one 📸