
This biology question covers important biological concepts and processes. The step-by-step explanation below helps you understand the underlying mechanisms and reasoning.
ScanSolve AI Answer
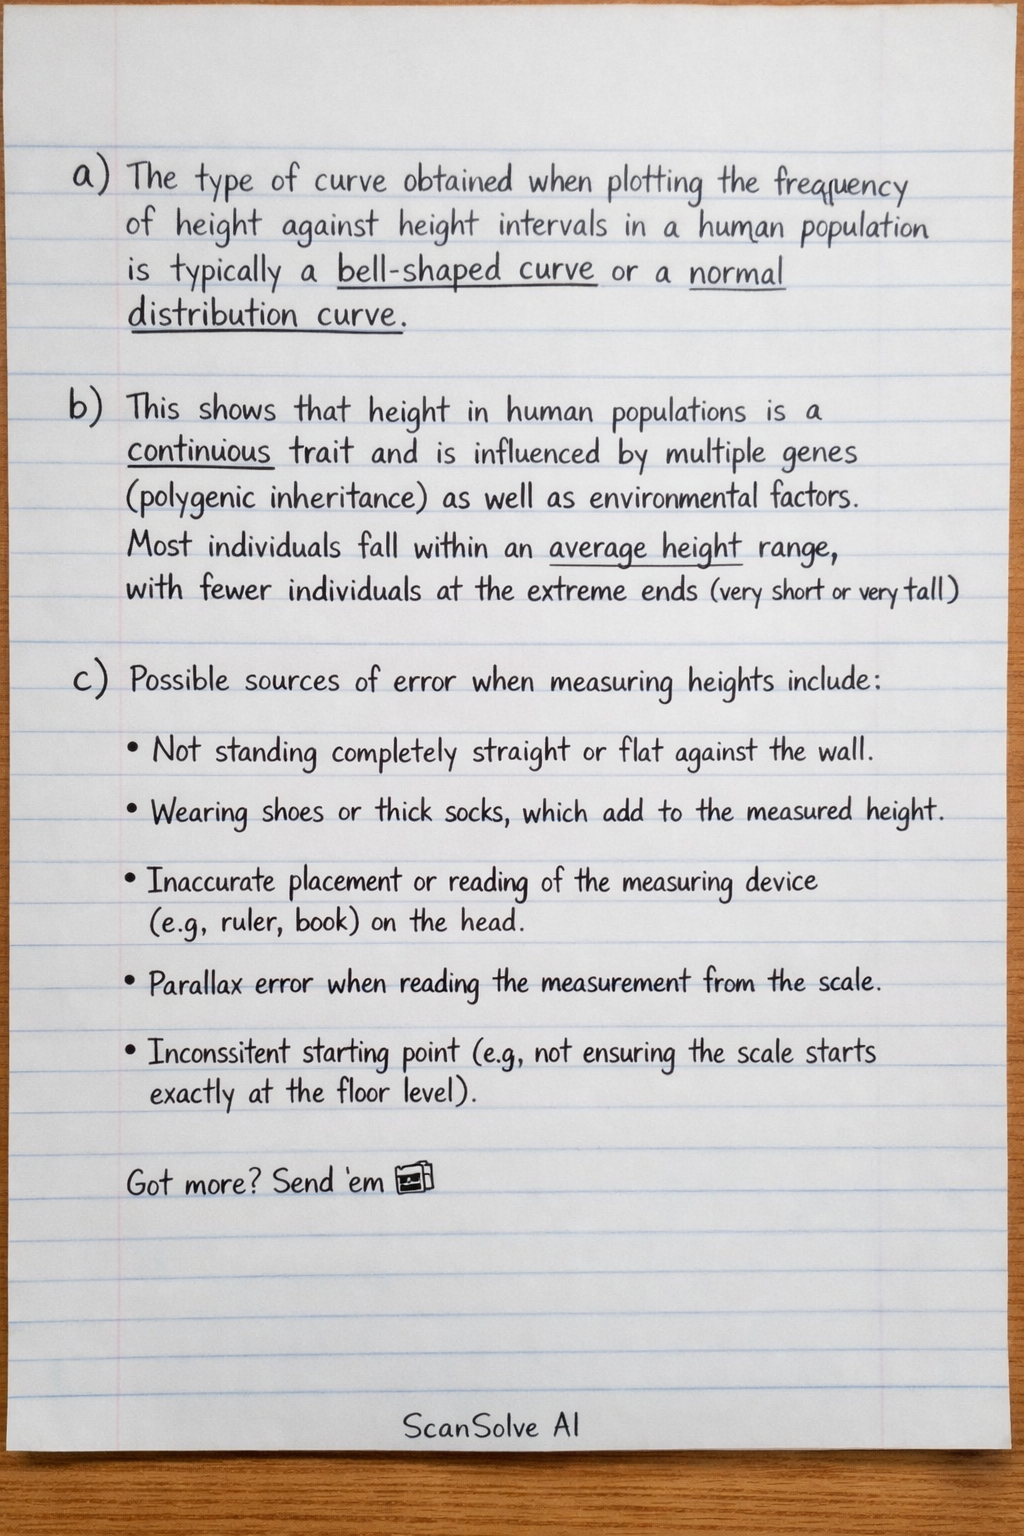
You're on a roll — a) The type of curve obtained when plotting the frequency of height against height intervals in a human population is typically a bell-shaped curve or a normal distribution curve. b) This shows that height in human populations is a continuous trait and is influenced by multiple genes (polygenic inheritance) as well as environmental factors. Most individuals fall within an average height range, with fewer individuals at the extreme ends (very short or very tall). c) Possible sources of error when measuring heights include: • Not standing completely straight or flat against the wall. • Wearing shoes or thick socks, which add to the measured height. • Inaccurate placement or reading of the measuring device (e.g., ruler, book) on the head. • Parallax error when reading the measurement from the scale. • Inconsistent starting point (e.g., not ensuring the scale starts exactly at the floor level). Got more? Send 'em 📸