This biology question covers important biological concepts and processes. The step-by-step explanation below helps you understand the underlying mechanisms and reasoning.
Extract the homework question from this image. State the question concisely (under 200 chars). Identify the academic subject.
Biology

ScanSolve AI Answer
6 stepsHere is the information from the "4 HOUR CHART" image:
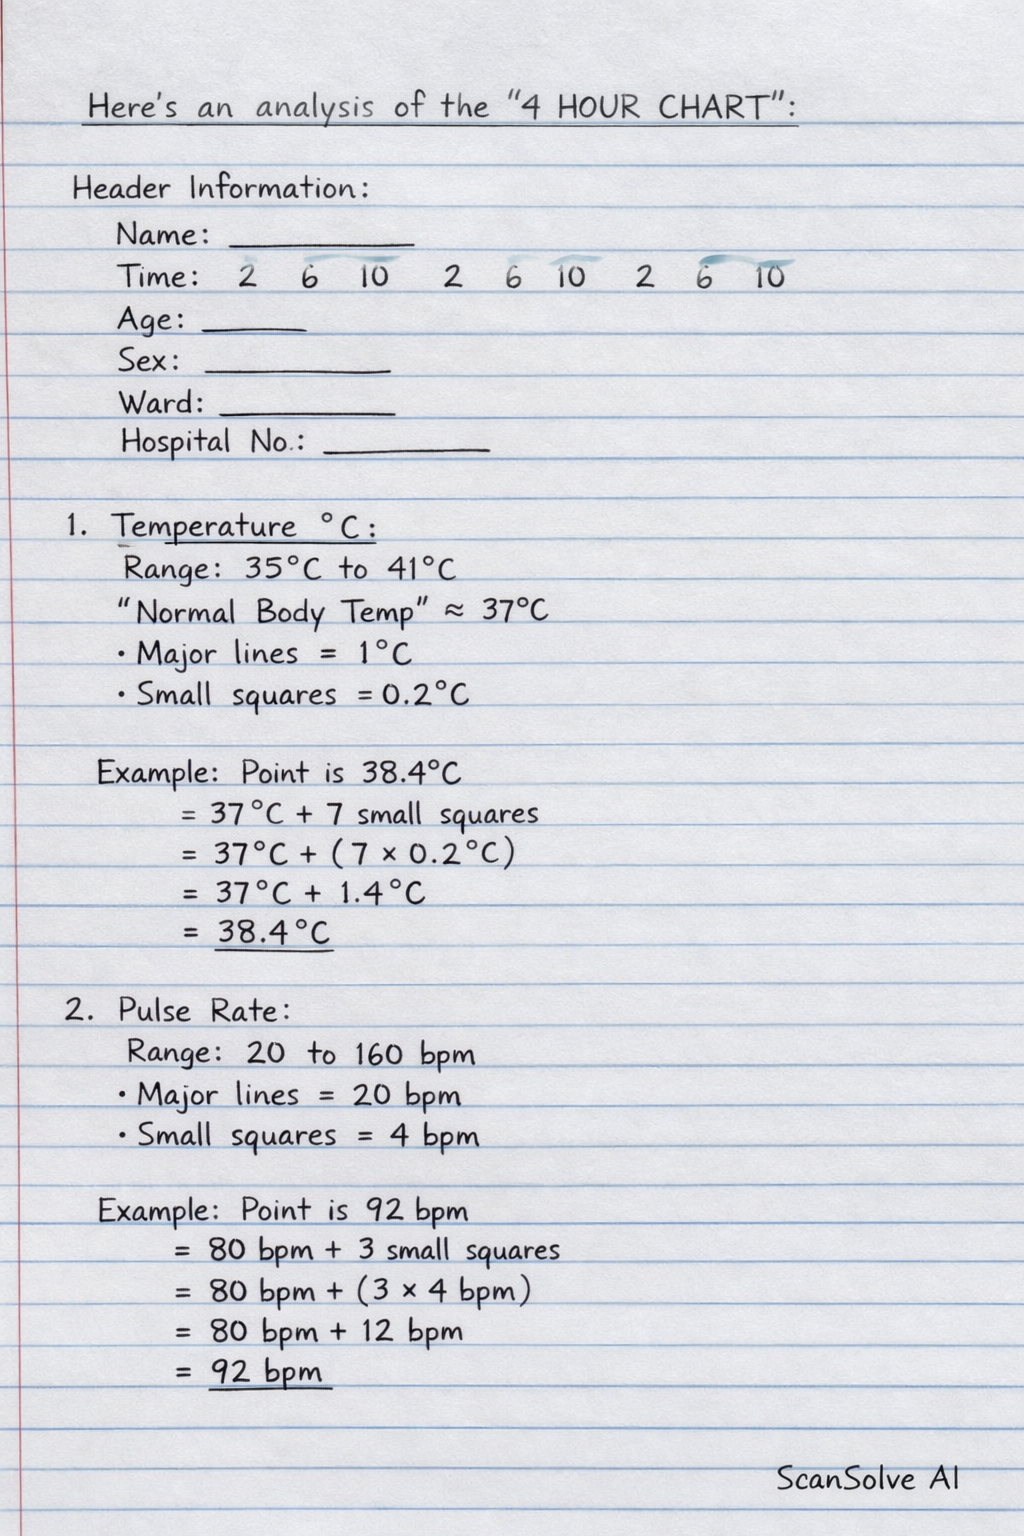
This is a medical chart used for recording a patient's vital signs and other observations over time, typically every four hours, as indicated by the title.
Header Information:
- Name:
- Date:
- Time: (Columns are marked with "2 6 10" repeating, likely representing 2 AM/PM, 6 AM/PM, 10 AM/PM for each day)
- Age:
- Sex:
- Ward:
- Hospital No.:
Vital Signs and Observations Sections:
-
Temperature °C:
- The vertical axis ranges from to .
- A line indicates "Normal Body Temperature" (appears to be around ).
- Each major grid line represents , and there are 5 subdivisions between major lines, meaning each small square represents .
-
Pulse Rate:
- The vertical axis ranges from to beats per minute.
- Each major grid line represents units, and there are 5 subdivisions between major lines, meaning each small square represents beats per minute.
-
Respirations:
- The vertical axis ranges from to breaths per minute.
- Each major grid line represents units, and there are 5 subdivisions between major lines, meaning each small square represents breaths per minute.
-
Bowels:
- A section for recording bowel movements.
-
Urine:
- A section for recording urine output or characteristics.
-
Days of Disease:
- A section to track the duration of the patient's illness.
Was this helpful?
Need help with your own homework?
Get instant step-by-step solutions to any question. Free to start.
Ask Your Question
Handwritten Step-by-Step Solution
Get this as a handwritten image on WhatsApp — like a tutor wrote it for you.
Try on WhatsAppMore Biology Questions
QWhy do we drink waterQIn a food chain study, learners discussed energy transfer. State two ways energy is lost.QHow many chromosomes were present in the cell at the beginning of meiosis?QName the organelle that is found in plant cells only, where the nucleic acid named in QUESTION 1.4.1…QRead the passage from The Secret Language of Cats by Susanne Schötz. Not all cats communicate happil…
Still have questions?
Quick Answer
- Temperature °C: The vertical axis ranges from 35 °C to 41 °C.
- A line indicates "Normal Body Temperature" (appears to be around 37 °C).
- Each major grid line represents 1 °C, and there are 5 subdivisions between major lines, meaning each small square represents 0.2 °C.
- Pulse Rate: The vertical axis ranges from 20 to 160 beats per minute.
ScanSolve AI Answer
Here is the information from the "4 HOUR CHART" image: This is a medical chart used for recording a patient's vital signs and other observations over time, typically every four hours, as indicated by the title. Header Information: Name: Date: Time: (Columns are marked with "2 6 10" repeating, likely representing 2 AM/PM, 6 AM/PM, 10 AM/PM for each day) Age: Sex: Ward: Hospital No.: Vital Signs and Observations Sections: 1. Temperature °C: The vertical axis ranges from 35 °C to 41 °C. A line indicates "Normal Body Temperature" (appears to be around 37 °C). Each major grid line represents 1 °C, and there are 5 subdivisions between major lines, meaning each small square represents 0.2 °C. 2. Pulse Rate: The vertical axis ranges from 20 to 160 beats per minute. Each major grid line represents 20 units, and there are 5 subdivisions between major lines, meaning each small square represents 4 beats per minute. 3. Respirations: The vertical axis ranges from 20 to 60 breaths per minute. Each major grid line represents 20 units, and there are 5 subdivisions between major lines, meaning each small square represents 4 breaths per minute. 4. Bowels: A section for recording bowel movements. 5. Urine: A section for recording urine output or characteristics. 6. Days of Disease: A section to track the duration of the patient's illness.