
We read your photo as:
Calculate the fixed and variable elements of the above mixed factory overhead using: i. The high and low method; ii. The linear regression analysis and determine the line of best fit.
ScanSolve AI Answer
Step-by-step solution
6 stepsHere's how to calculate the fixed and variable elements of the mixed factory overhead using the requested methods.
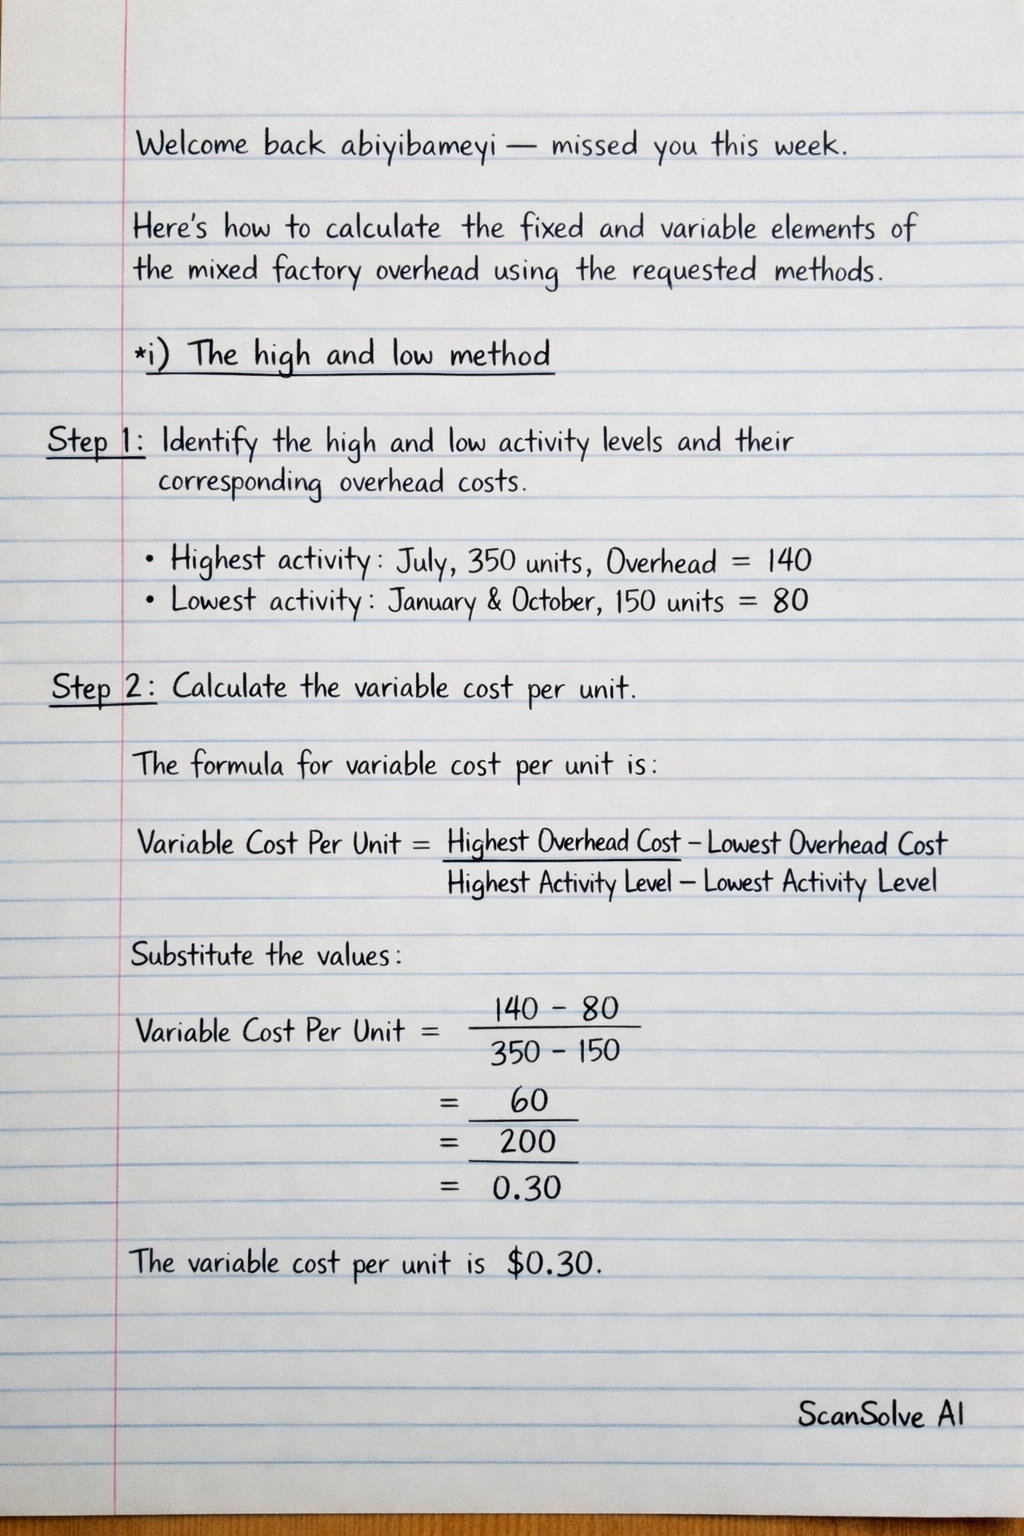
i) The high and low method
Identify the high and low activity levels and their corresponding overhead costs.
From the table:
- Highest activity: July, 350 units, Overhead = 140
- Lowest activity: January and October, 150 units, Overhead = 80
Calculate the variable cost per unit.
The formula for variable cost per unit is:
Substitute the values:
The variable cost per unit is $0.30.
Calculate the total fixed cost.
Total fixed cost can be found by taking the total cost at either the high or low activity level and subtracting the total variable cost at that level.
Using the high activity level (July):Using the low activity level (January/October):
The fixed cost is $35.
ii) The linear regression analysis and determine the line of best fit
Set up the data for linear regression.
We need the sum of , , , , and the number of observations ().
Month Units (x) Overhead (y) January 150 80 22500 12000 February 200 100 40000 20000 March 300 135 90000 40500 April 250 125 62500 31250 May 300 130 90000 39000 June 250 120 62500 30000 July 350 140 122500 49000 August 300 125 90000 37500 September 250 115 62500 28750 October 150 80 22500 12000 Total 2700 1150 660000 290000 Calculate the slope () and y-intercept () using the least squares method.
The formula for the slope () is:
Substitute the values:
The variable cost per unit (slope) is approximately $0.2971.
The formula for the y-intercept () is:
Substitute the values:
The fixed cost (y-intercept) is approximately $34.78.
Determine the line of best fit.
The line of best fit is represented by the equation , where is the total overhead, is the fixed cost, is the variable cost per unit, and is the number of units.
Summary of results:
i) High and Low Method:
- Variable Cost Per Unit:
- Fixed Cost:
ii) Linear Regression Analysis:
- Variable Cost Per Unit:
- Fixed Cost:
- Line of Best Fit:
Still stuck on this one?
Ask a follow-up, and the answer starts from this question.
More Business/Management Questions
Handwritten Step-by-Step Solution
Get this as a handwritten image on WhatsApp — like a tutor wrote it for you.
Try on WhatsApp