
We read your photo as:
Janis has demand for 40,000 desks p.a. and the purchase price of each desk is 25. There are ordering costs of 20 for each order placed. Inventory holding costs amount to 10% p.a. of inventory value. Calculate the inventory costs p.a. for the following order quantities, and plot them on a graph:
ScanSolve AI Answer
Answers
4 partsStep-by-step solution
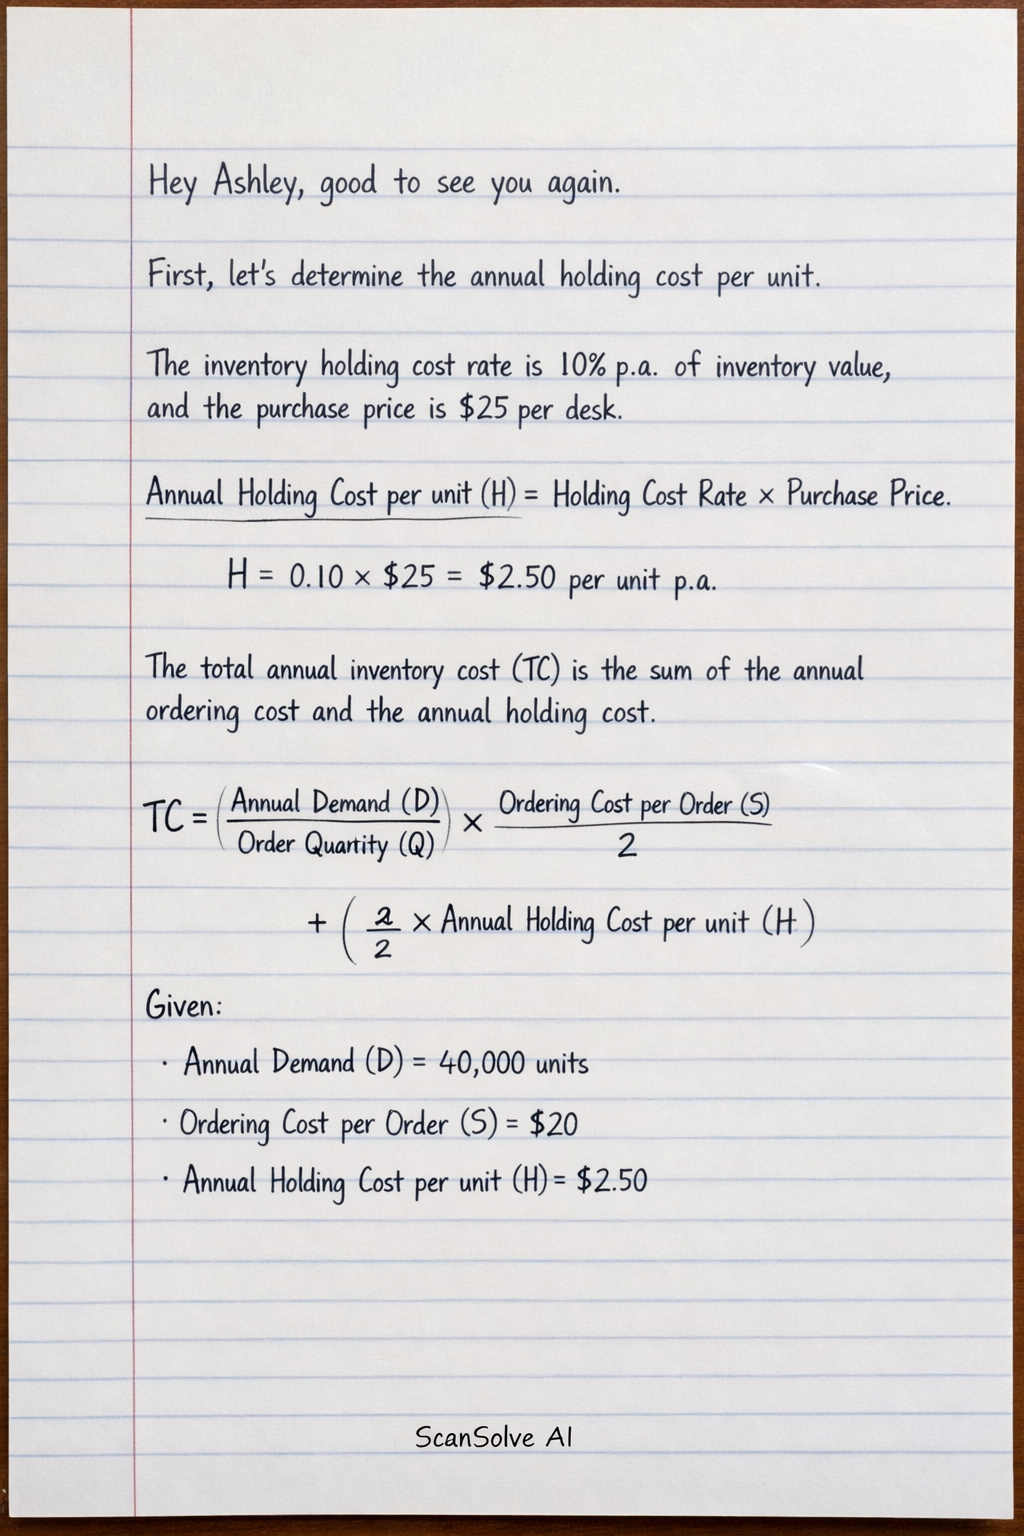
12 stepsFirst, let's determine the annual holding cost per unit.
The inventory holding cost rate is 10% p.a. of inventory value, and the purchase price is $25 per desk.
The total annual inventory cost (TC) is the sum of the annual ordering cost and the annual holding cost.
Given:
Annual Demand (D) = 40,000 units
Ordering Cost per Order (S) = 2.50
Part a· 3 steps
500 units
Calculate Annual Ordering Cost.
Calculate Annual Holding Cost.
Calculate Total Annual Inventory Cost.
Part b\2,004.17$
\2,004.17$
750 units
Calculate Annual Ordering Cost.
Calculate Annual Holding Cost.
Calculate Total Annual Inventory Cost.
Part c\2,050$
\2,050$
1,000 units
Calculate Annual Ordering Cost.
Calculate Annual Holding Cost.
Calculate Total Annual Inventory Cost.
Part d\2,202.50$
\2,202.50$
1,250 units
Calculate Annual Ordering Cost.
Calculate Annual Holding Cost.
Calculate Total Annual Inventory Cost.
To plot these on a graph, you would use the order quantity (Q) on the x-axis and the total annual inventory cost (TC) on the y-axis. The points to plot are:
- (500 units, $2,225)
- (750 units, $2,004.17)
- (1,000 units, $2,050)
- (1,250 units, $2,202.50)
Still stuck on this one?
Ask a follow-up, and the answer starts from this question.
More Business/Management Questions
Handwritten Step-by-Step Solution
Get this as a handwritten image on WhatsApp — like a tutor wrote it for you.
Try on WhatsApp