
This business/management problem is solved step by step below, with detailed explanations to help you understand the method and arrive at the correct answer.
ScanSolve AI Answer
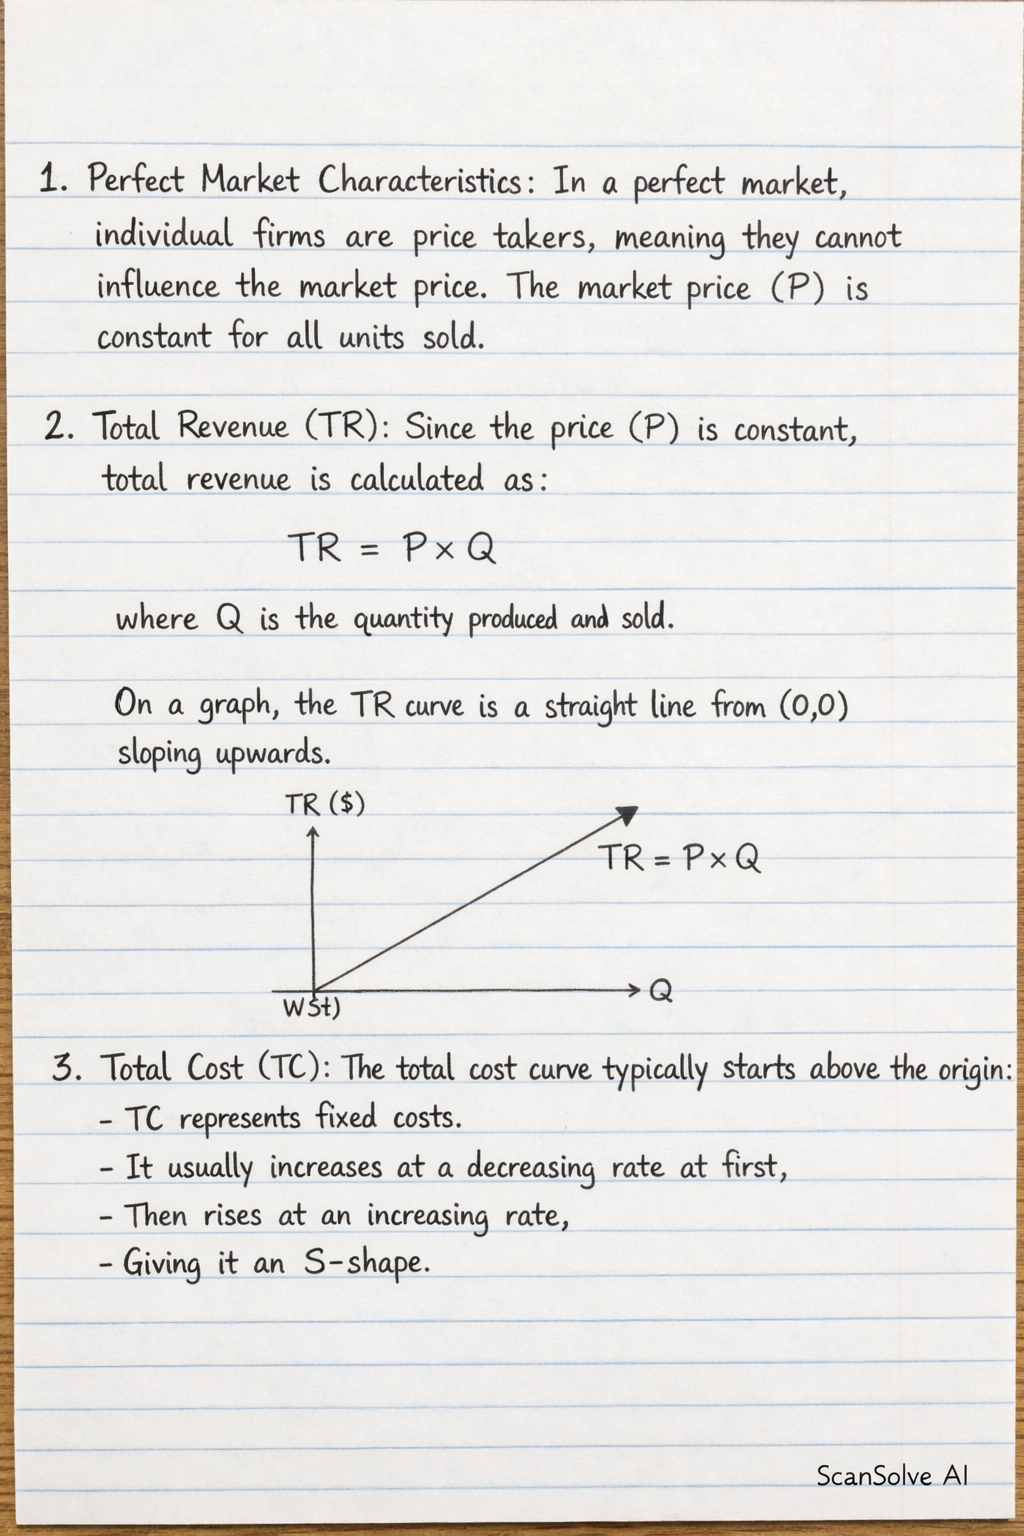
To explain profit maximization in a perfect market using a graph of total cost (TC) and total revenue (TR): 1. Perfect Market Characteristics: In a perfect market, individual firms are price takers, meaning they cannot influence the market price. The market price (P) is constant for all units sold. 2. Total Revenue (TR): Since the price (P) is constant, total revenue is calculated as TR = P × Q, where Q is the quantity produced and sold. On a graph, the TR curve is a straight line originating from the origin (0,0) and sloping upwards, as each additional unit sold adds a constant amount (P) to total revenue. 3. Total Cost (TC): The total cost curve typically starts above the origin (representing fixed costs even at zero production). It usually increases at a decreasing rate initially (due to economies of scale or increasing returns), then increases at an increasing rate (due to diminishing returns or diseconomies of scale), giving it an S-shape. 4. Profit Maximization: Profit () is the difference between total revenue and total cost: = TR - TC. A firm maximizes profit by producing the quantity where the positive vertical distance between the TR curve and the TC curve is the greatest. 5. Graphical Representation: Plot Quantity (Q) on the horizontal axis and Revenue/Cost on the vertical axis. Draw the TR curve as a straight line starting from the origin, sloping upwards. Draw the TC curve starting above the origin, initially flatter, then becoming steeper. The firm breaks even at the two points where the TR curve intersects the TC curve (where TR = TC, so = 0). Profit is positive when the TR curve is above the TC curve. The profit-maximizing quantity is found where the vertical distance between the TR curve and the TC curve is largest, with TR being above TC. At this quantity, the slope of the TR curve (which is Marginal Revenue, MR, and equals the market price P in a perfect market) is equal to the slope of the TC curve (which is Marginal Cost*, MC). Thus, profit is maximized where P = MC. Send me the next one 📸