
We read your photo as:
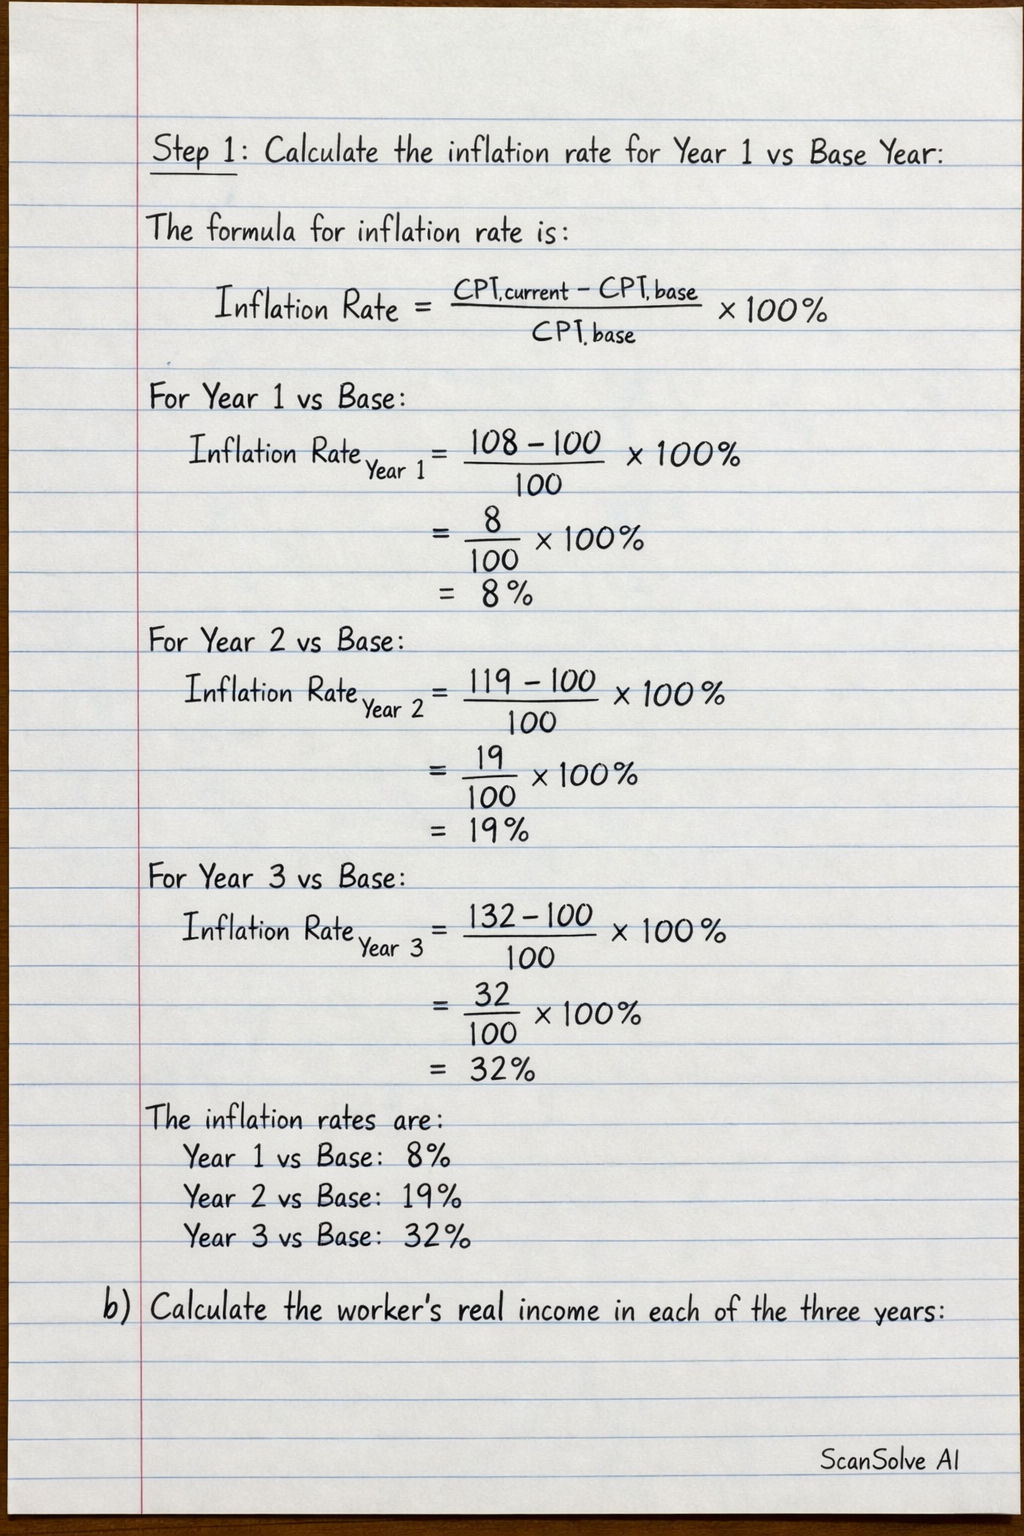
Calculate the inflation rate for Year 1 vs Base Year.
ScanSolve AI Answer
Step-by-step solution
4 stepsHere's the inflation analysis:
Part a· 1 step
Calculate the inflation rate for each year
Calculate the inflation rate for Year 1 vs Base Year.
The formula for inflation rate is:
For Year 1 vs Base:
For Year 2 vs Base:
For Year 3 vs Base:
The inflation rates are:
- Year 1 vs Base:
\boxed{\text{8%}} - Year 2 vs Base:
\boxed{\text{19%}} - Year 3 vs Base:
\boxed{\text{32%}}
- Year 1 vs Base:
Part b· 1 step
Calculate the worker's real income in each of the three years
Calculate real income for each year.
The formula for real income is:
Given Nominal Salary = K18,000 and Base Year CPI = 100.
For Year 1:
For Year 2:
For Year 3:
The real incomes are:
- Year 1:
- Year 2:
- Year 3:
Part c· 1 step
In which year is the worker WORST OFF in terms of real purchasing power? Justify your answer
Identify the year with the lowest real income.
Comparing the real incomes:
- Year 1: K16,666.67
- Year 2: K15,126.05
- Year 3: K13,636.36
The worker is worst off in . This is because the real income in Year 3 (K13,636.36) is the lowest, meaning their purchasing power has been eroded the most by inflation compared to the other years.
Part d· 1 step
Using the Quantity Theory of Money (MV = PT), explain what change in money supply may have caused this inflation in Year 3
Explain inflation in Year 3 using the Quantity Theory of Money.
The Quantity Theory of Money states that , where is the money supply, is the velocity of money, is the price level, and is the volume of transactions (or real output). Assuming that the velocity of money () and the volume of transactions () remain relatively constant in the short run, an increase in the money supply () directly leads to a proportional increase in the price level (). Therefore, the inflation observed in Year 3 could have been caused by a significant () in the economy.
Still stuck on this one?
Ask a follow-up, and the answer starts from this question.
More Economics Questions
Handwritten Step-by-Step Solution
Get this as a handwritten image on WhatsApp — like a tutor wrote it for you.
Try on WhatsApp