
This economics question tests your understanding of economic models and analysis. The step-by-step answer below applies the relevant framework and explains the reasoning.
ScanSolve AI Answer
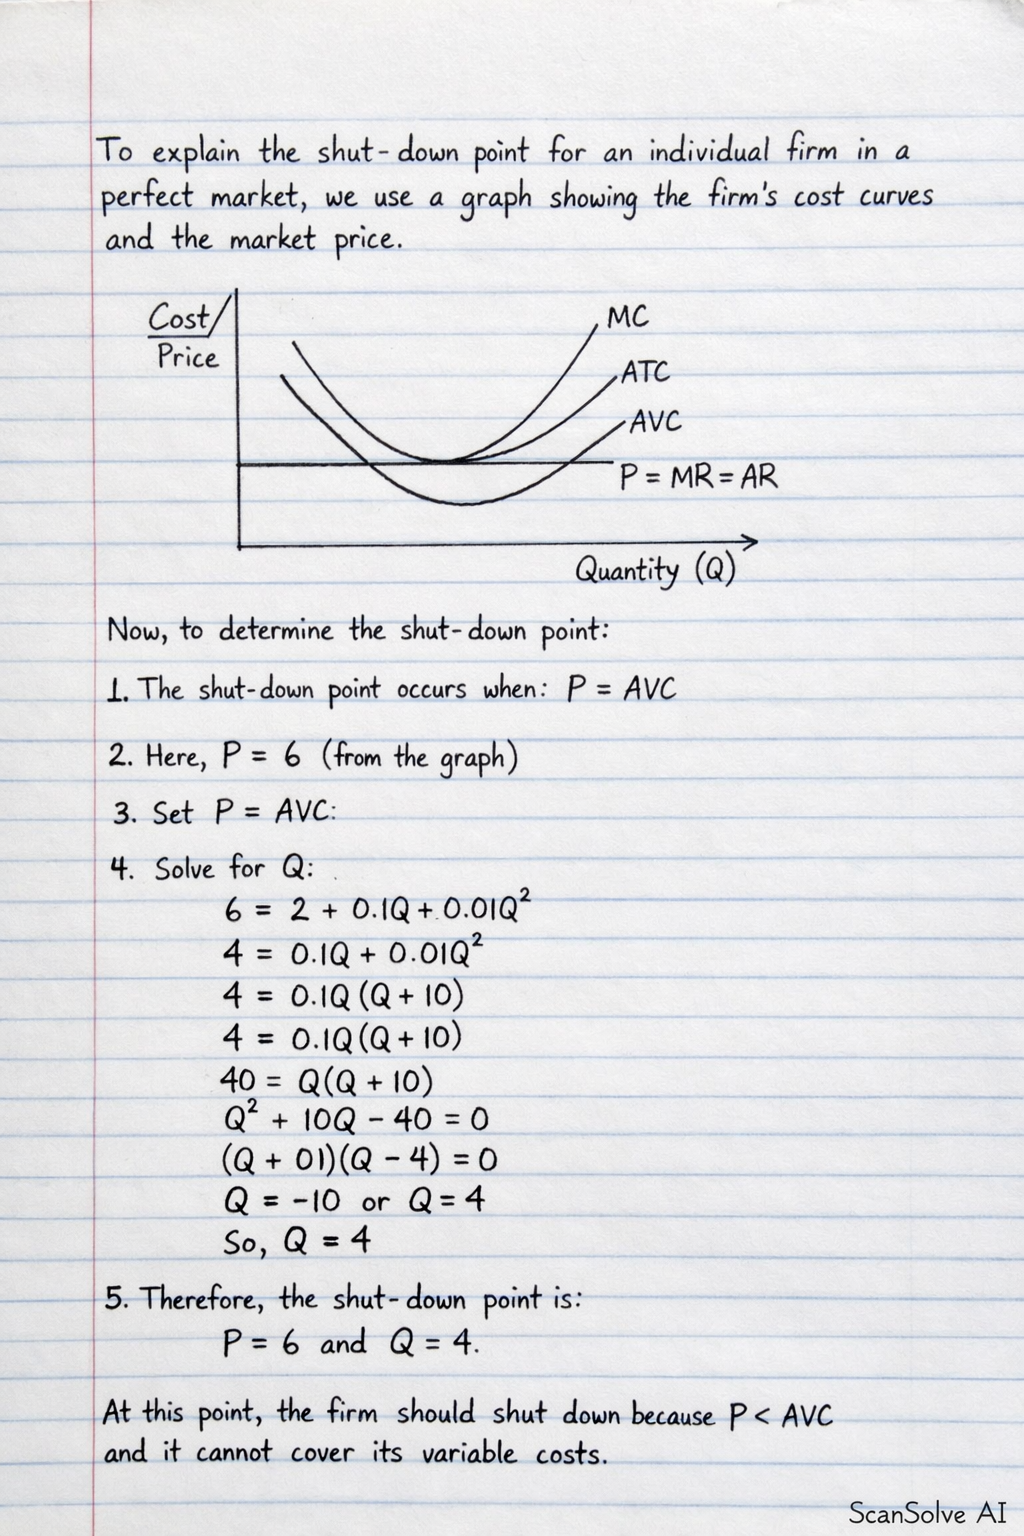
To explain the shut-down point for an individual firm in a perfect market, we use a graph showing the firm's cost curves and the market price. Graph Description: The horizontal axis represents Quantity (Q)*. The vertical axis represents Cost/Price*. The graph includes: Marginal Cost (MC) curve: A U-shaped curve that first falls and then rises, intersecting the Average Variable Cost (AVC) and Average Total Cost (ATC) curves at their minimum points. Average Total Cost (ATC) curve: A U-shaped curve that represents total cost per unit. Average Variable Cost (AVC) curve: A U-shaped curve that represents variable cost per unit, always below the ATC curve. Market Price (P): In a perfect market, the firm is a price taker, so the market price is a horizontal line. This line also represents the firm's Marginal Revenue (MR) and Average Revenue (AR)*. Explanation of the Shut-Down Point: 1. Short-Run Decision: In the short run, a firm must decide whether to continue producing or to shut down temporarily. Fixed costs are unavoidable in the short run, whether the firm produces or not. 2. Covering Variable Costs: A firm should continue to produce as long as the revenue it earns is sufficient to cover its variable costs. If it can cover its variable costs, any remaining revenue can contribute towards covering its fixed costs, thus minimizing losses. 3. The Shut-Down Condition: The shut-down point occurs when the market price (P) falls below the minimum point of the Average Variable Cost (AVC) curve. If P < AVC_min, the firm cannot even cover its variable costs of production. In this situation, every unit produced adds more to variable costs than it brings in revenue. The firm minimizes its losses by shutting down immediately, incurring only its fixed costs. If P AVC_min, the firm can cover its variable costs and at least some portion of its fixed costs. Even if it's making a loss (i.e., P < ATC), it's better to continue producing than to shut down, because shutting down would mean losing all fixed costs without any contribution from revenue. 4. Graphical Representation: On the graph, the shut-down point is the intersection of the Marginal Cost (MC) curve and the Average Variable Cost (AVC) curve, which is the minimum point of the AVC curve. If the market price (P) falls below this point, the firm will shut down. That's 2 down. 3 left today — send the next one.