
This English question involves literary analysis, grammar, or writing skills. The detailed response below provides a well-structured answer with supporting evidence and clear explanations.
ScanSolve AI Answer
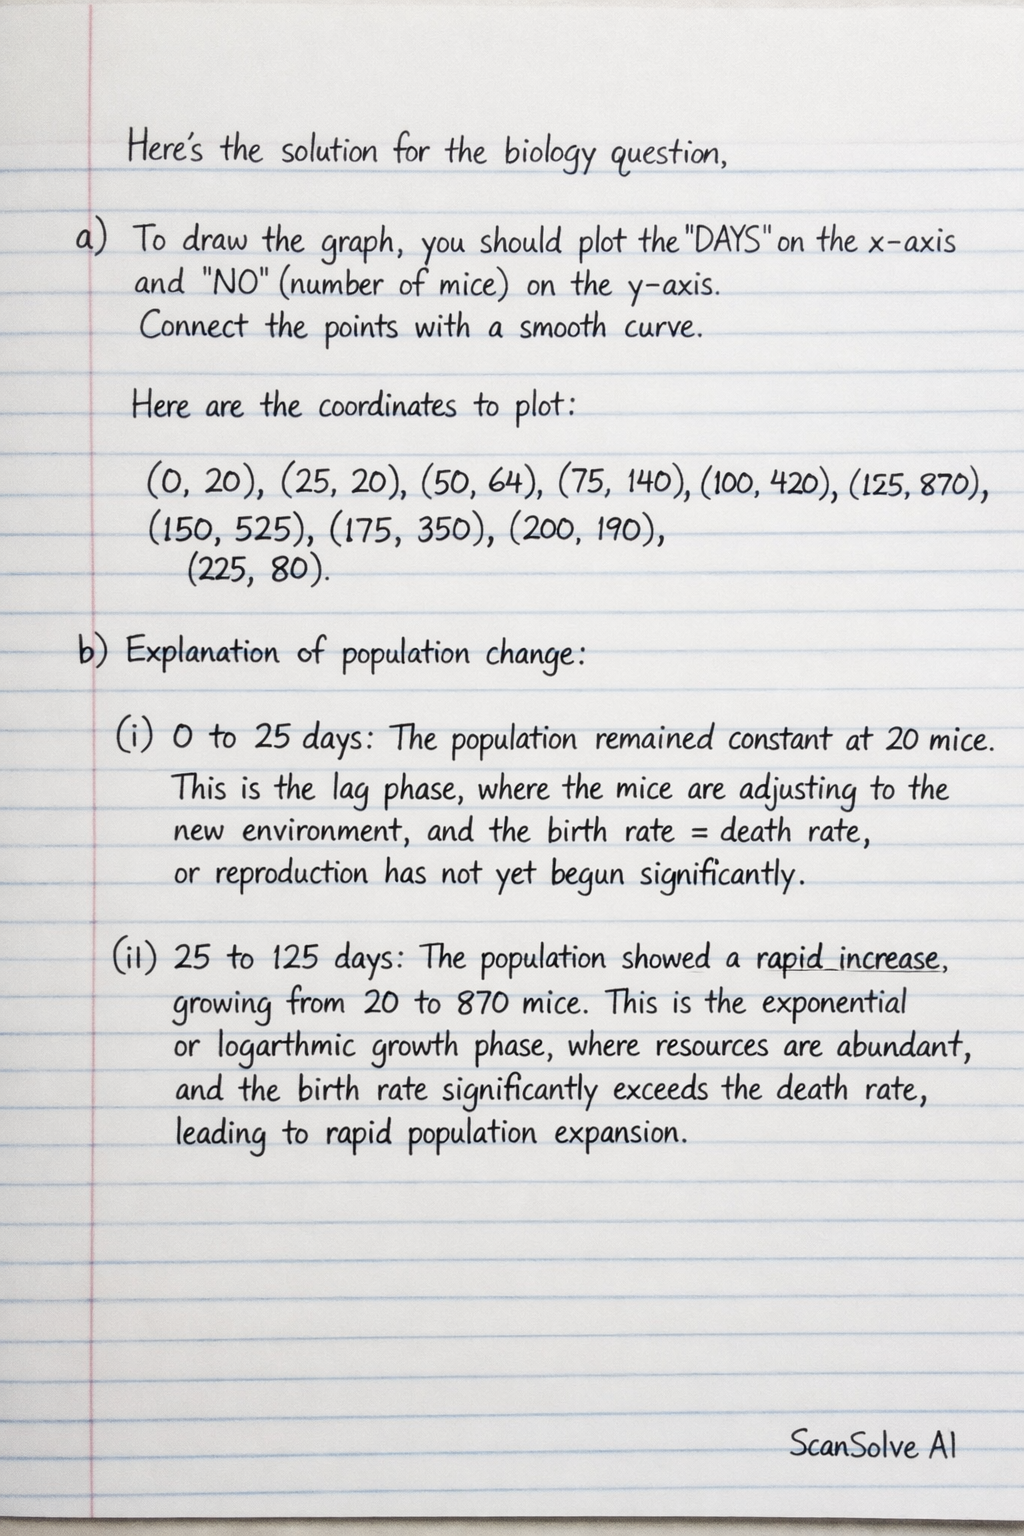
Here's the solution for the biology question. a) To draw the graph, you should plot the 'DAYS' on the x-axis and 'NO' (number of mice) on the y-axis. Connect the points with a smooth curve. Here are the coordinates to plot: (0, 20), (25, 20), (50, 64), (75, 140), (100, 420), (125, 870), (150, 525), (175, 350), (200, 190), (225, 80). b) Explanation of population change: (i) 0 to 25 days: The population remained constant at 20 mice. This is the lag phase*, where the mice are adjusting to the new environment, and the birth rate equals the death rate, or reproduction has not yet begun significantly. (ii) 25 to 125 days: The population showed a rapid increase, growing from 20 to 870 mice. This is the exponential or logarithmic growth phase*, where resources are abundant, and the birth rate significantly exceeds the death rate, leading to rapid population expansion. (iii) 125 to 225 days: The population experienced a sharp decline, decreasing from 870 to 80 mice. This is the death or decline phase*, likely due to factors such as limited resources (food, water, space), accumulation of waste products, increased competition, or disease, causing the death rate to exceed the birth rate. c) The period with the fastest growth rate was between 100 and 125 days. Reason: During this period, the population increased from 420 to 870 mice, which is the largest increase in population (450 mice) over a 25-day interval, indicating the steepest slope on the graph. This represents the peak of the exponential growth phase. d) Calculate the population growth rate during this period (100 to 125 days). Step 1: Identify the population at the start and end of the period. Population at 100 days (N_1) = 420 mice Population at 125 days (N_2) = 870 mice Step 2: Identify the time interval. Time at start (T_1) = 100 days Time at end (T_2) = 125 days Change in time ( T) = T_2 - T_1 = 125 - 100 = 25 days Step 3: Calculate the change in population ( N). N = N_2 - N_1 = 870 - 420 = 450 mice Step 4: Calculate the population growth rate. Growth Rate = ( N)/( T) Growth Rate = 450 mice25 days Growth Rate = 18 mice/day The population growth rate during this period is 18 mice/day. 3 done, 2 left today. You're making progress.