

This English question involves literary analysis, grammar, or writing skills. The detailed response below provides a well-structured answer with supporting evidence and clear explanations.
ScanSolve AI Answer
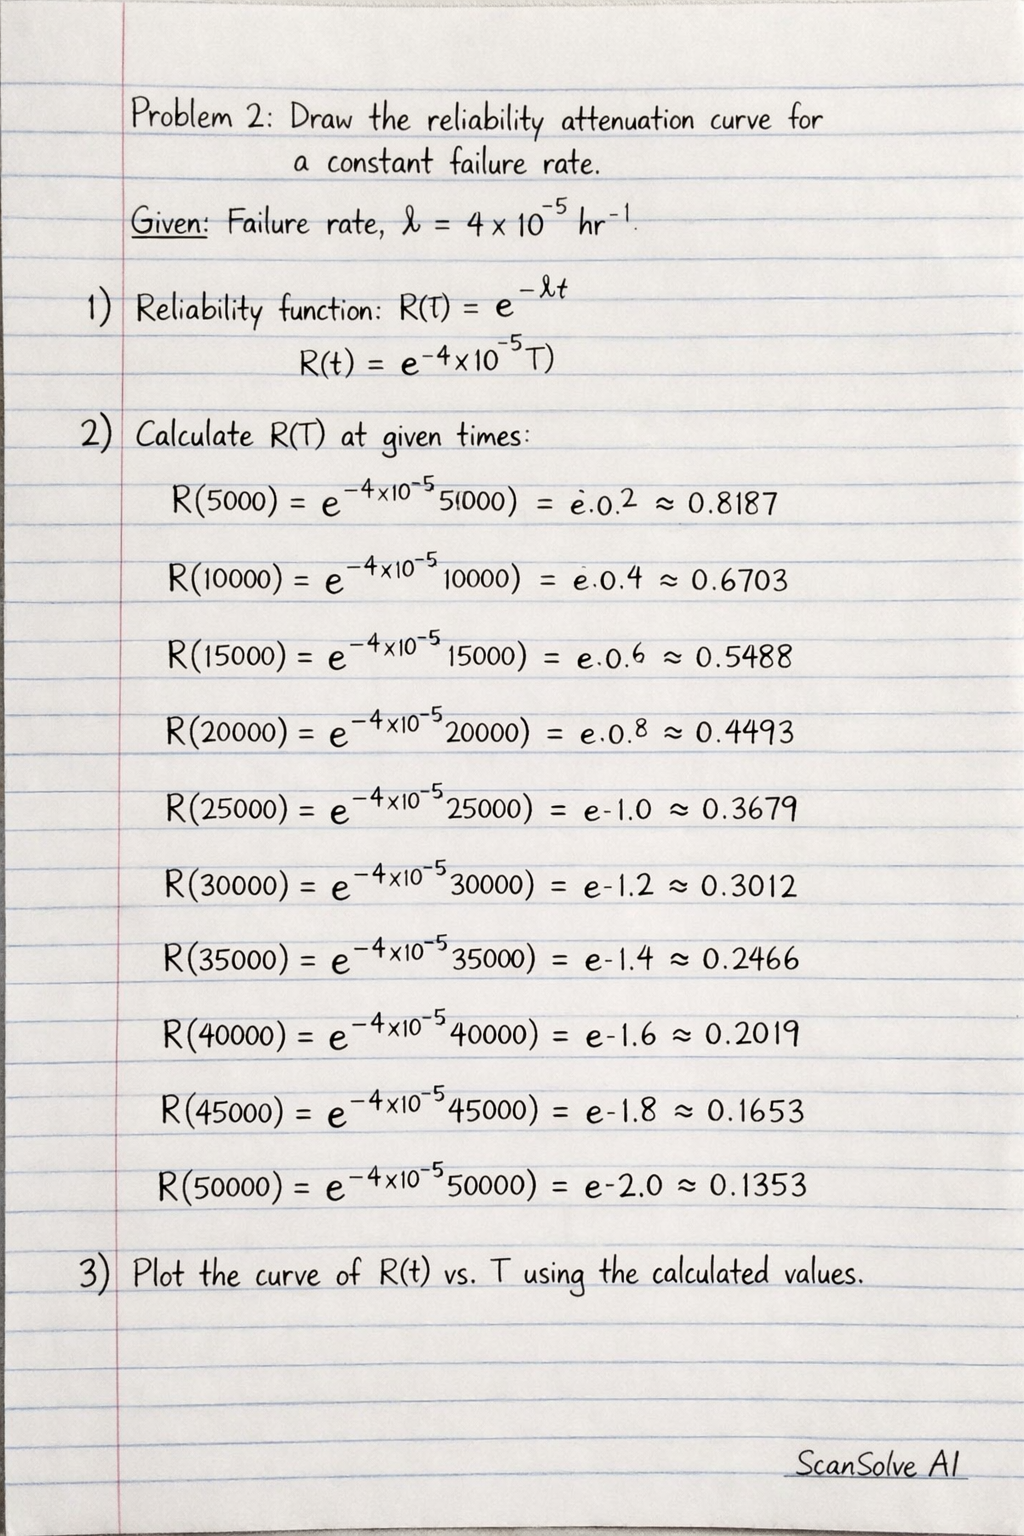
Problem 1: Problem 1 is incomplete. To determine the number of functioning/failed units, unreliability, and MTS (Mean Time To System failure or Mean Time To Failure), additional information such as the number of observed failures, the duration of operation, or a specific failure rate for this equipment is required. The problem statement only provides the total number of units (1000) but no data on their operational status or failure events. Problem 2: The problem asks to draw a reliability attenuation curve for a constant failure rate. Given: Failure rate = 4 × 10^-5 hr^-1 Times T = [5000 hr, 10000 hr, 15000 hr, 20000 hr, 25000 hr, 30000 hr, 35000 hr, 40000 hr, 45000 hr, 50000 hr] Step 1: Recall the Mean Time To Failure (MTTF) and reliability values. From the previous calculation, the MTTF is 25000 hr. The reliability values R(t) = e^- t at the given times are: |c|c| Time (hr) & Reliability R(t) \\ 5000 & 0.8187 \\ 10000 & 0.6703 \\ 15000 & 0.5488 \\ 20000 & 0.4493 \\ 25000 & 0.3679 \\ 30000 & 0.3012 \\ 35000 & 0.2466 \\ 40000 & 0.2019 \\ 45000 & 0.1653 \\ 50000 & 0.1353 \\ Step 2: Describe the axes for the graph. To plot the reliability attenuation curve: • The x-axis represents Time (hr). It should range from 0 to at least 50000 hr. • The y-axis represents Reliability R(t). It should range from 0 to 1. Step 3: Describe how to plot the points and the resulting curve. • Plot the points from the table, with time on the x-axis and reliability on the y-axis. For example, plot (5000, 0.8187), (10000, 0.6703), and so on. • At time t=0, the reliability is R(0) = e^0 = 1. So, the curve starts at the point (0, 1). • Connect these plotted points with a smooth curve. The resulting graph will be an exponential decay curve. It will start at 1 on the y-axis and continuously decrease as time increases on the x-axis, approaching 0 but never quite reaching it. The curve will pass through the point (25000 hr, 0.3679), which corresponds to the MTTF where reliability is e^-1.