
This English question involves literary analysis, grammar, or writing skills. The detailed response below provides a well-structured answer with supporting evidence and clear explanations.
ScanSolve AI Answer
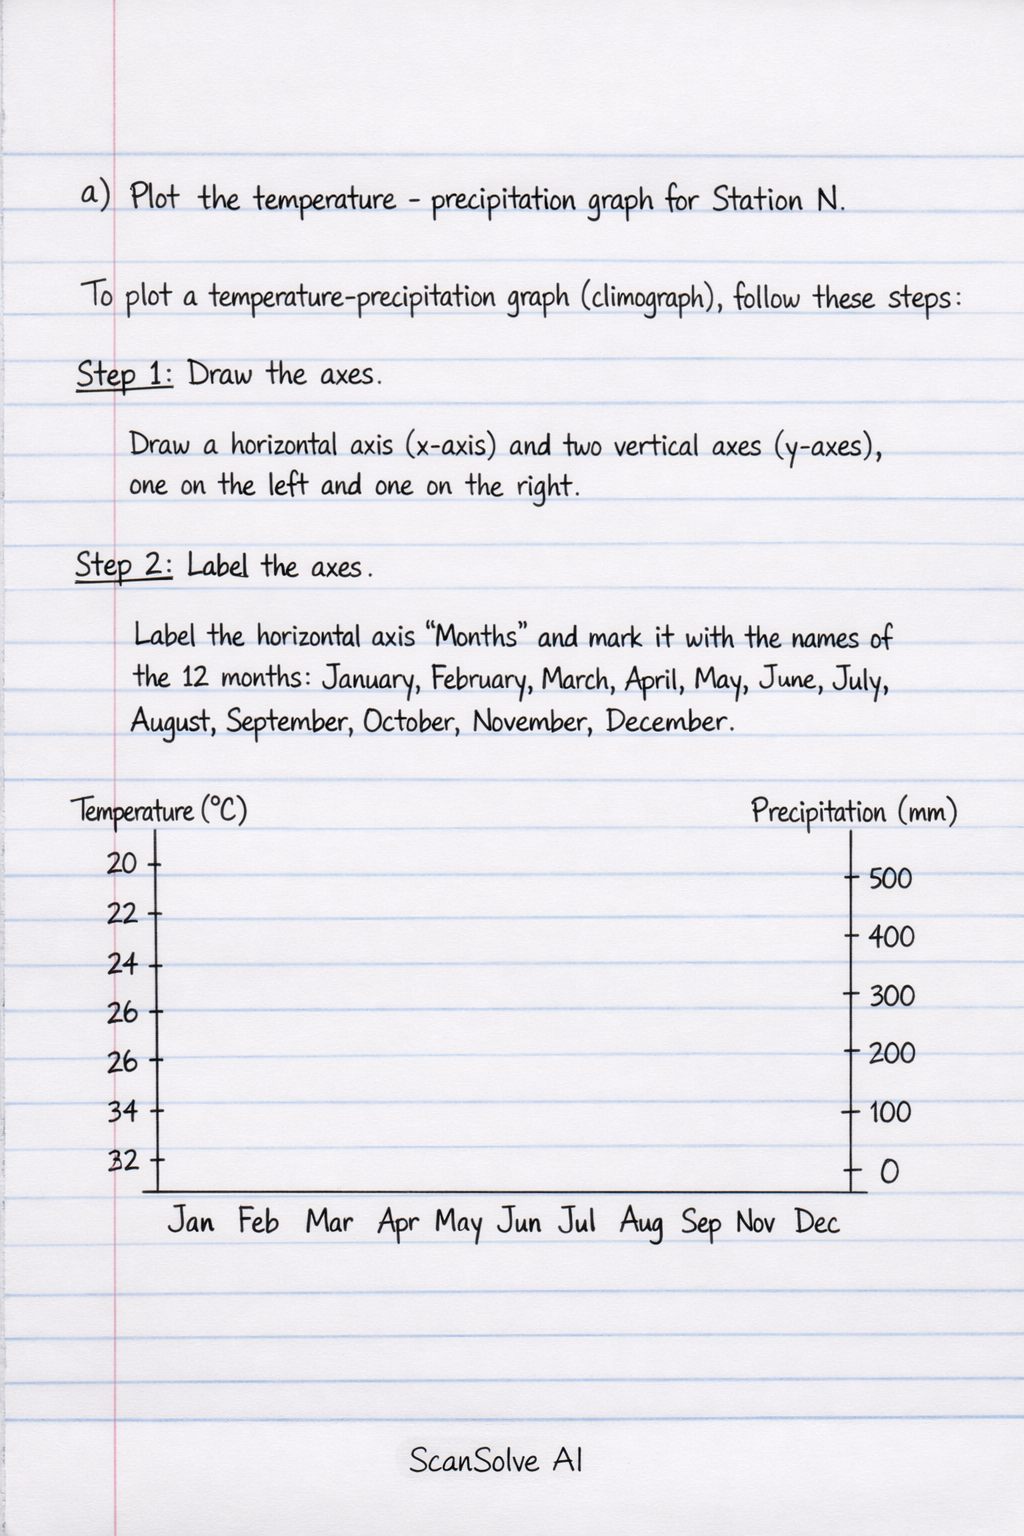
Here are the solutions for the questions based on the provided table for Station N. Table Data for Station N: | Months | J | F | M | A | M | J | J | A | S | O | N | D | |-------------|-----|-----|-----|-----|-----|-----|-----|-----|-----|-----|-----|-----| | Temperature (°C)| 27 | 28 | 28 | 28 | 27 | 28 | 28 | 28 | 28 | 28 | 28 | 27 | | Rainfall (mm)| 23 | 83 | 128 | 228 | 274 | 378 | 391 | 300 | 434 | 323 | 112 | 58 | a) Plot the temperature - precipitation graph for Station N. To plot a temperature-precipitation graph (climograph), follow these steps: Step 1: Draw the axes. Draw a horizontal axis (x-axis) and two vertical axes (y-axes), one on the left and one on the right. Step 2: Label the axes. Label the horizontal axis "Months" and mark it with the names of the 12 months: January, February, March, April, May, June, July, August, September, October, November, December. Label the left vertical axis "Temperature (^)" and the right vertical axis "Precipitation (mm)". Step 3: Scale the vertical axes. For temperature, the values range from 27^ to 28^. Choose a suitable scale for the left vertical axis, for example, increments of 1^ starting from 25^ or 26^. For precipitation, the values range from 23 mm to 434 mm. Choose a suitable scale for the right vertical axis, for example, increments of 50 mm or 100 mm, extending slightly beyond 434 mm (e.g., up to 450 mm). Step 4: Plot the temperature line graph. For each month, plot a point corresponding to its temperature on the left vertical axis. Connect these points with a smooth line. • January: 27^ • February: 28^ • March: 28^ • April: 28^ • May: 27^ • June: 28^ • July: 28^ • August: 28^ • September: 28^ • October: 28^ • November: 28^ • December: 27^ Step 5: Plot the precipitation bar graph. For each month, draw a vertical bar whose height corresponds to the rainfall amount on the right vertical axis. • January: 23 mm • February: 83 mm • March: 128 mm • April: 228 mm • May: 274 mm • June: 378 mm • July: 391 mm • August: 300 mm • September: 434 mm • October: 323 mm • November: 112 mm • December: 58 mm b) Calculate: i) Annual Range of temperature for the Station. Step 1: Identify the maximum and minimum temperatures. Maximum temperature = 28^ (occurs in February, March, April, June, July, August, September, October, November). Minimum temperature = 27^ (occurs in January, May, December). Step 2: Calculate the annual range. Annual Range = Maximum Temperature - Minimum Temperature Annual Range = 28^ - 27^ Annual Range = 1^ The annual range of temperature is 1^. ii) What is the annual rainfall for the Station? Step 1: Sum all monthly rainfall amounts. Annual Rainfall = 23 + 83 + 128 + 228 + 274 + 378 + 391 + 300 + 434 + 323 + 112 + 58 Annual Rainfall = 2732 mm The annual rainfall is 2732 mm. 3 done, 2 left today. You're making progress.