
We read your photo as:
Can you plot the draph
English
ScanSolve AI Answer
Step-by-step solution
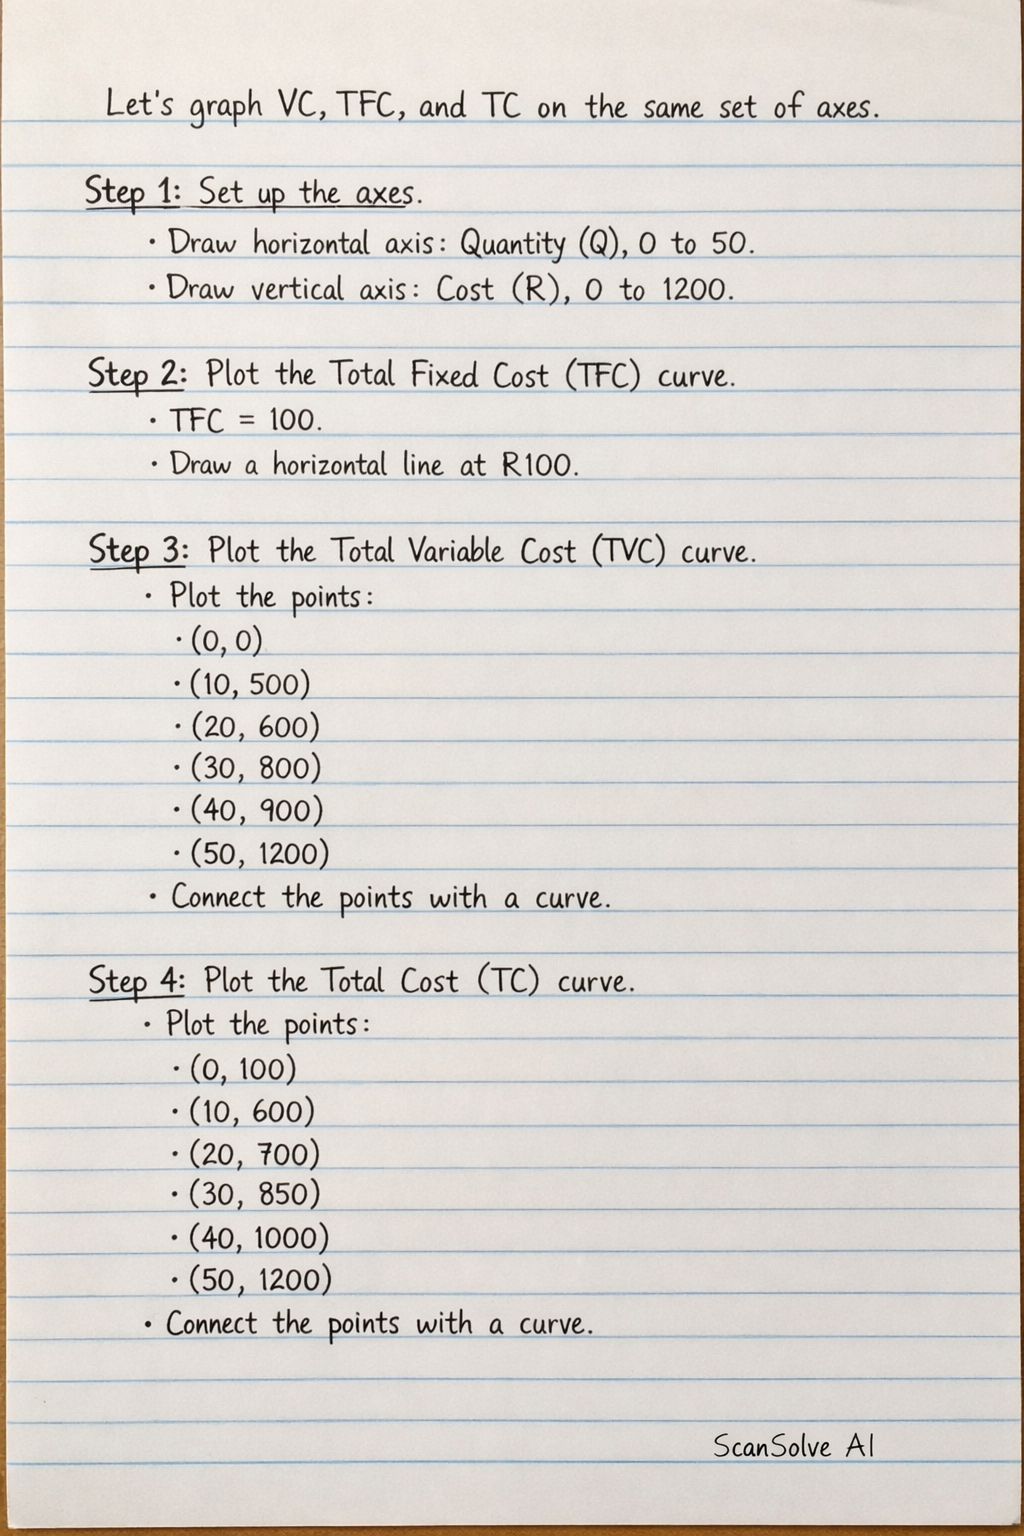
4 stepsTo draw the graph for VC, TFC, and TC on the same set of axes, follow these steps:
Set up the axes.
- Draw a horizontal axis (x-axis) and label it "Quantity (Q)". Mark values from 0 to 50.
- Draw a vertical axis (y-axis) and label it "Cost (R)". Mark values from 0 to 1200.
Plot the Total Fixed Cost (TFC) curve.
- TFC is constant at R100 for all quantities.
- Plot a horizontal straight line at the R100 mark on the y-axis, extending across all quantities on the x-axis. This line represents the TFC curve.
Plot the Total Variable Cost (TVC) curve.
- Plot the following points from the table:
- (0, 0)
- (10, 500)
- (20, 600)
- (30, 800)
- (40, 900)
- (50, 1200)
- Connect these points with a smooth curve. This curve represents the TVC curve.
- Plot the following points from the table:
Plot the Total Cost (TC) curve.
- Plot the following points from the table:
- (0, 100)
- (10, 600)
- (20, 700)
- (30, 850)
- (40, 1000)
- (50, 1200)
- Connect these points with a smooth curve. This curve represents the TC curve.
Key observations for your graph:
- The TFC curve is a horizontal line.
- The TVC curve starts at the origin (0,0) and increases as quantity increases.
- The TC curve starts at the same point as the TFC curve on the y-axis (at Q=0, TC=TFC) and is parallel to the TVC curve, always R100 above it.
- Plot the following points from the table:
Was this helpful?
Still stuck on this one?
Ask a follow-up, and the answer starts from this question.
Got a different question?Ask your own question
More English Questions
Handwritten Step-by-Step Solution
Get this as a handwritten image on WhatsApp — like a tutor wrote it for you.
Try on WhatsApp