This English question involves literary analysis, grammar, or writing skills. The detailed response below provides a well-structured answer with supporting evidence and clear explanations.
ScanSolve AI Answer
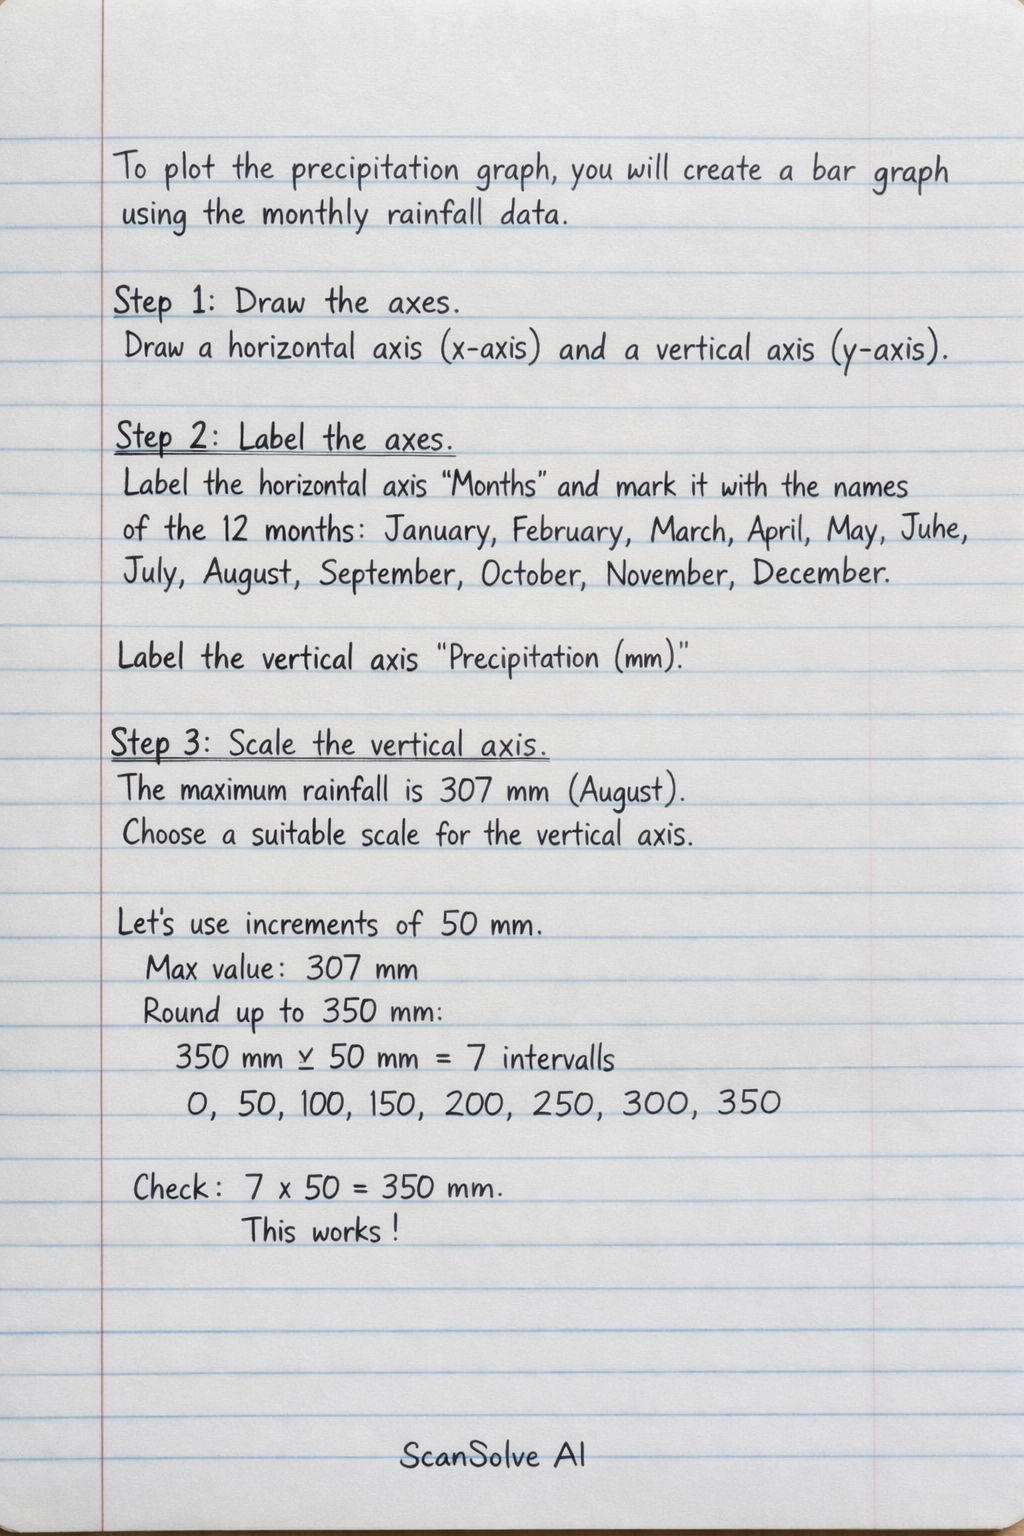
To plot the precipitation graph, you will create a bar graph using the monthly rainfall data. Step 1: Draw the axes. Draw a horizontal axis (x-axis) and a vertical axis (y-axis). Step 2: Label the axes. Label the horizontal axis "Months" and mark it with the names of the 12 months: January, February, March, April, May, June, July, August, September, October, November, December. Label the vertical axis "Precipitation (mm)". Step 3: Scale the vertical axis. The maximum rainfall is 307 mm (August). Choose a suitable scale for the vertical axis, for example, increments of 50 mm or 100 mm, extending slightly beyond 307 mm (e.g., up to 350 mm). Step 4: Plot the bars for each month's precipitation. For each month, draw a vertical bar whose height corresponds to the rainfall amount for that month: • January: 0 mm • February: 3 mm • March: 3 mm • April: 13 mm • May: 64 mm • June: 122 mm • July: 201 mm • August: 307 mm • September: 146 mm • October: 13 mm • November: 0 mm • December: 1 mm The completed graph will show bars of varying heights representing the monthly precipitation. That's 2 down. 3 left today — send the next one.