
This English question involves literary analysis, grammar, or writing skills. The detailed response below provides a well-structured answer with supporting evidence and clear explanations.
ScanSolve AI Answer
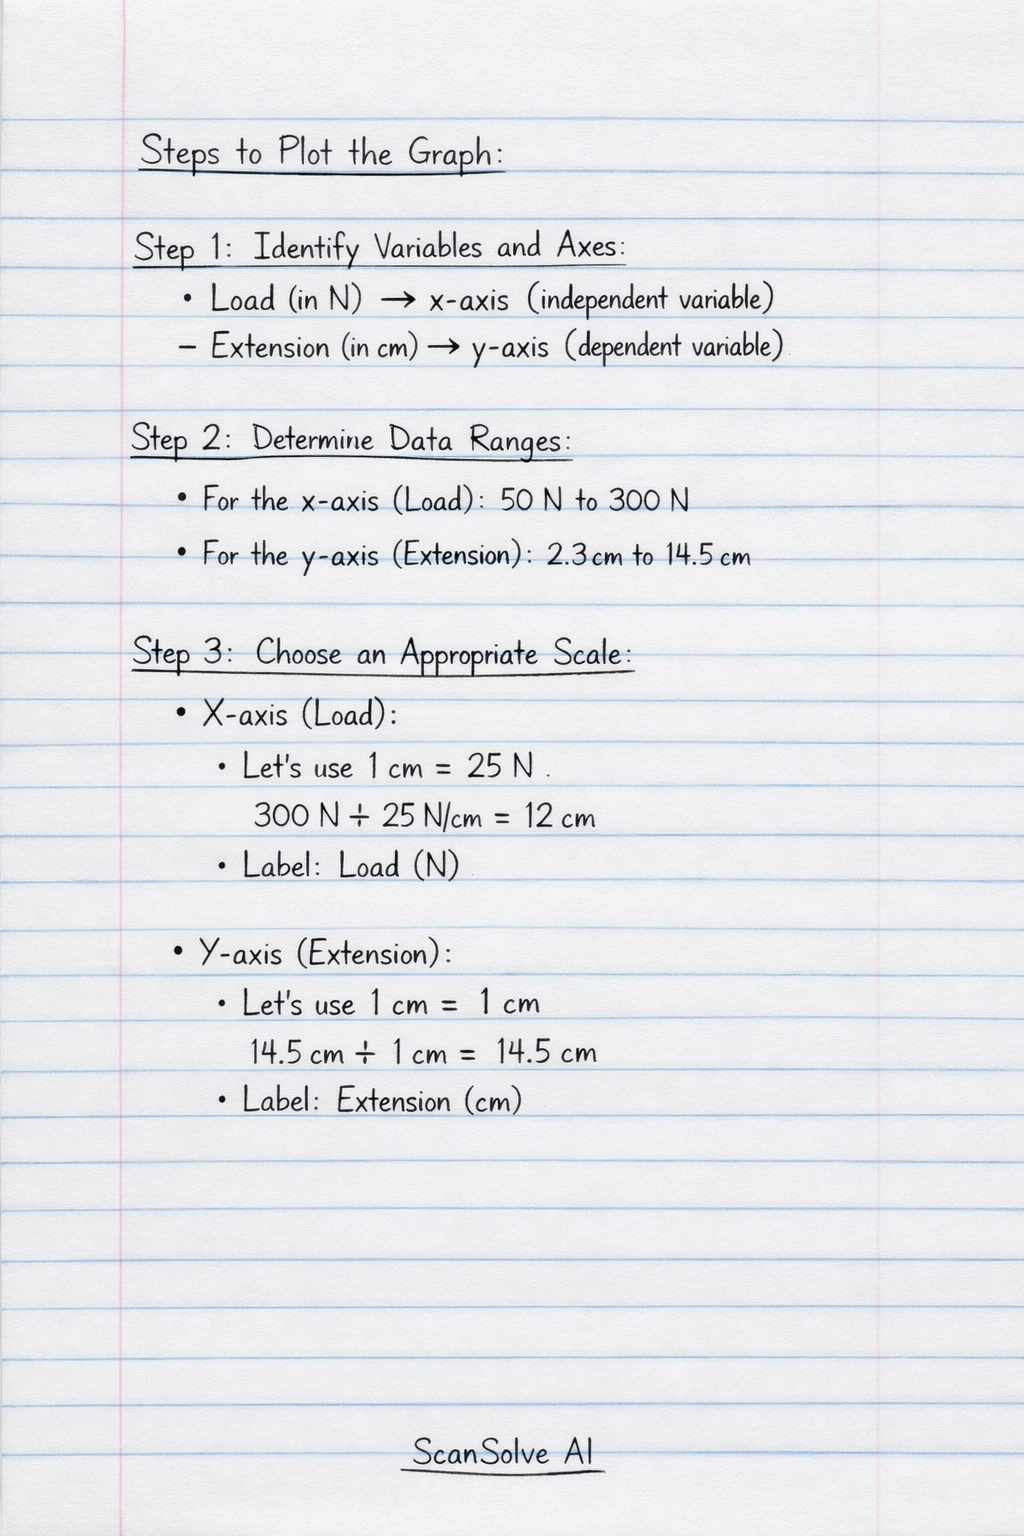
To plot the graph, you will use the Load values on the x-axis and the Extension values on the y-axis. Here are the steps to plot the graph: Step 1: Identify Variables and Axes • The Load (in N) is the independent variable and should be plotted on the x-axis. • The Extension (in cm) is the dependent variable and should be plotted on the y-axis. Step 2: Determine Data Ranges • For the x-axis (Load): The values range from 50\, N to 300\, N. • For the y-axis (Extension): The values range from 2.3\, cm to 14.5\, cm. Step 3: Choose an Appropriate Scale • X-axis (Load): Choose a scale that allows all load values to fit comfortably. For example, 1\, cm on your graph paper could represent 25\, N or 50\, N. Label the axis "Load (N)". • Y-axis (Extension): Choose a scale that allows all extension values to fit. For example, 1\, cm on your graph paper could represent 1\, cm or 2\, cm. Label the axis "Extension (cm)". Step 4: Plot the Data Points Plot the following points on your graph paper: • (50, 2.3) • (100, 4.6) • (150, 6.9) • (200, 9.6) • (250, 12.0) • (300, 14.5) Step 5: Draw the Line of Best Fit Draw a smooth curve or a straight line that best represents the trend of the plotted points. Since the relationship between load and extension is often linear for elastic materials, a straight line of best fit is likely appropriate for the initial points. Observe if the line starts to curve at higher loads, indicating the elastic limit might have been approached or exceeded. Send me the next one 📸