
This English question involves literary analysis, grammar, or writing skills. The detailed response below provides a well-structured answer with supporting evidence and clear explanations.
ScanSolve AI Answer
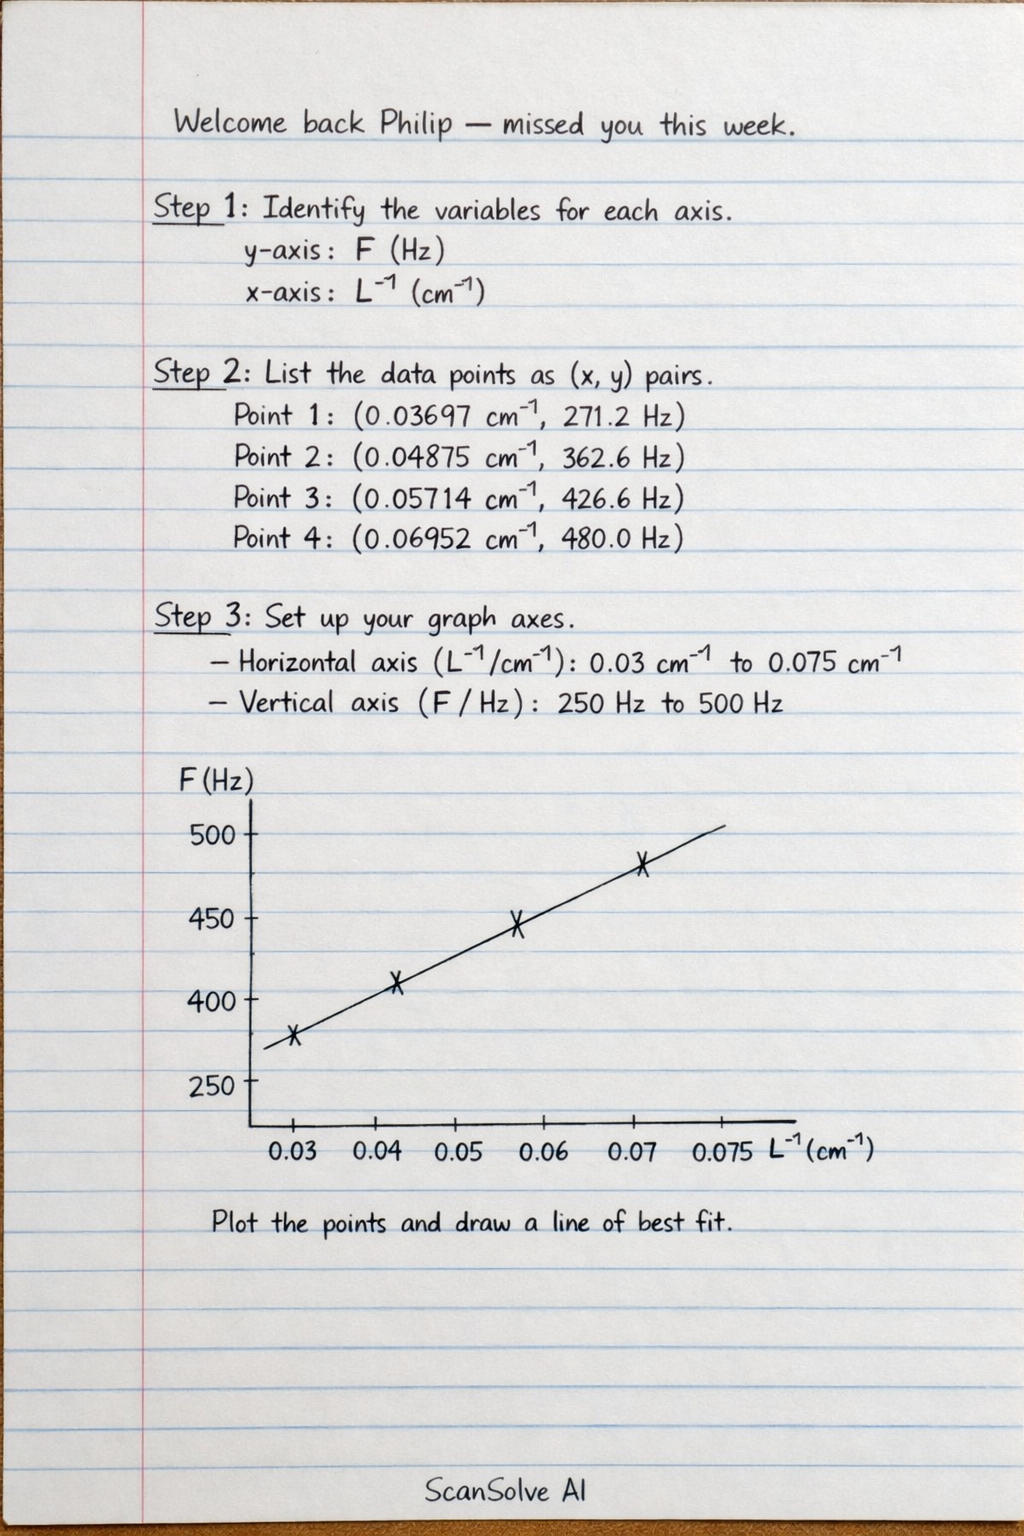
Welcome back Philip — missed you this week. To plot the graph, you need to identify the coordinates for each point based on the given instructions. Step 1: Identify the variables for each axis. The problem states to plot F/Hz on the vertical axis (y-axis) and L^-1/cm^-1 on the horizontal axis (x-axis). Step 2: List the data points as (x, y) pairs. Using the given data, the points to plot are: • Point 1: (0.03597 \, cm^-1, 271.2 \, Hz) • Point 2: (0.04875 \, cm^-1, 362.6 \, Hz) • Point 3: (0.05714 \, cm^-1, 426.6 \, Hz) • Point 4: (0.06952 \, cm^-1, 480.0 \, Hz) Step 3: Set up your graph axes. • For the horizontal axis (L^-1/cm^-1), a suitable range would be from 0.03 \, cm^-1 to 0.075 \, cm^-1. • For the vertical axis (F/Hz), a suitable range would be from 250 \, Hz to 500 \, Hz. Plot these points on graph paper, label your axes with the correct units, and draw a line of best fit. Send me the next one 📸