
This English question involves literary analysis, grammar, or writing skills. The detailed response below provides a well-structured answer with supporting evidence and clear explanations.
ScanSolve AI Answer
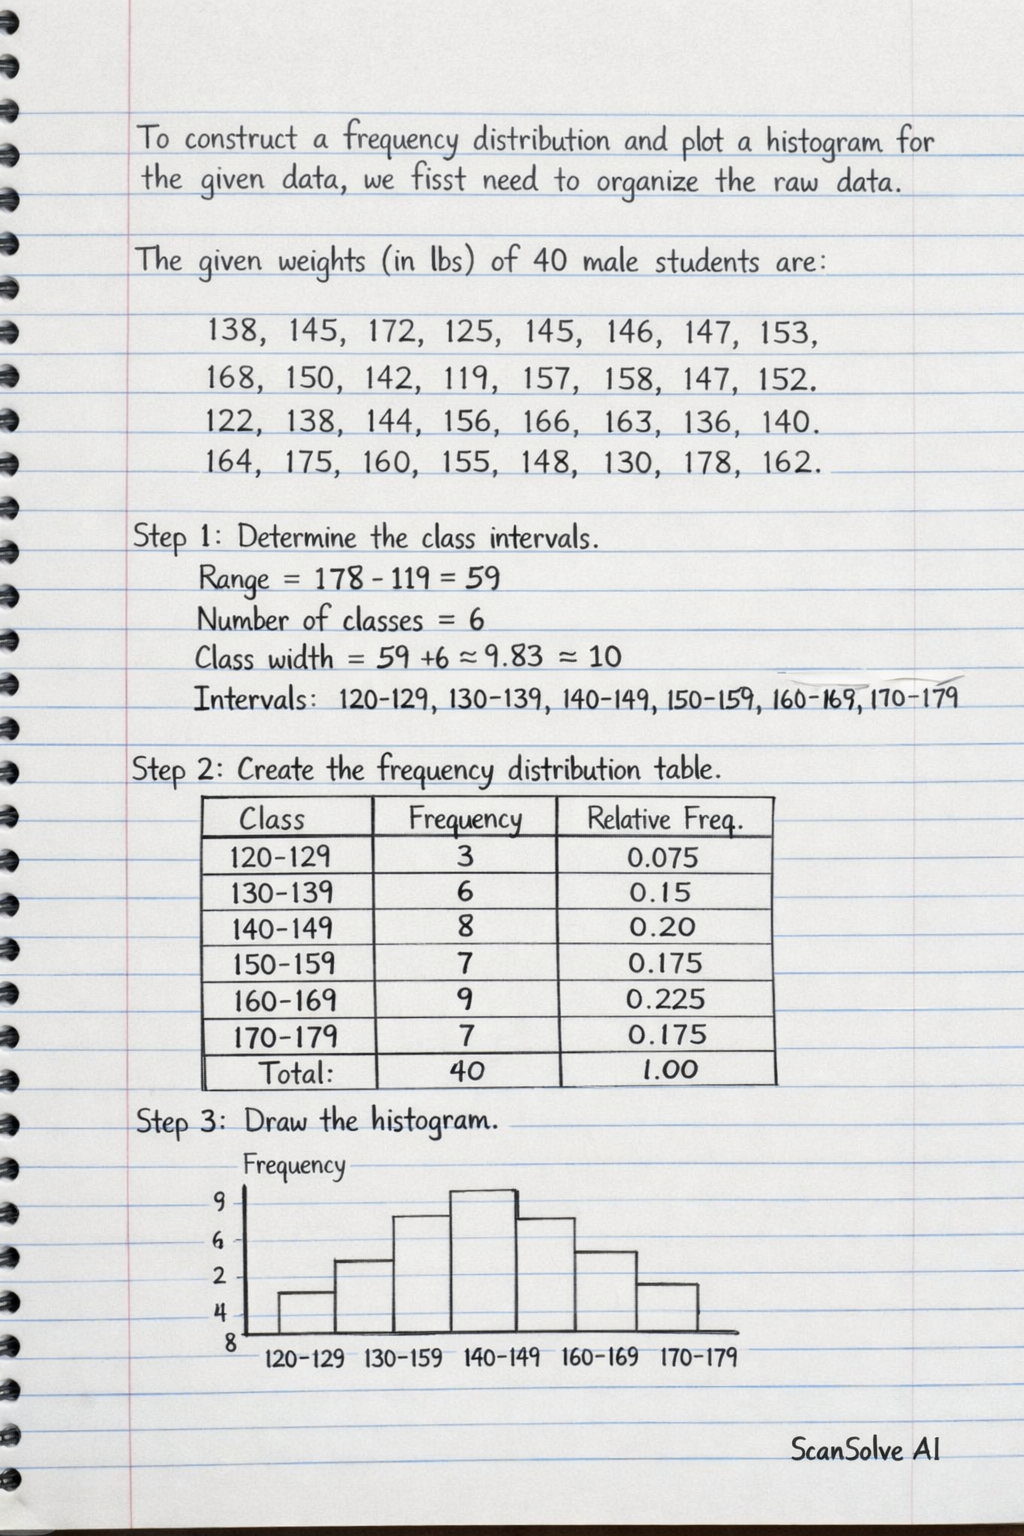
To construct a frequency distribution and plot a histogram for the given data, we first need to organize the raw data. The given weights (in lbs) of 40 male students are: 138, 145, 172, 125, 145, 146, 147, 153 168, 150, 142, 119, 157, 158, 147, 152 122, 138, 144, 156, 165, 173, 136, 140 164, 1