
This English question involves literary analysis, grammar, or writing skills. The detailed response below provides a well-structured answer with supporting evidence and clear explanations.
ScanSolve AI Answer
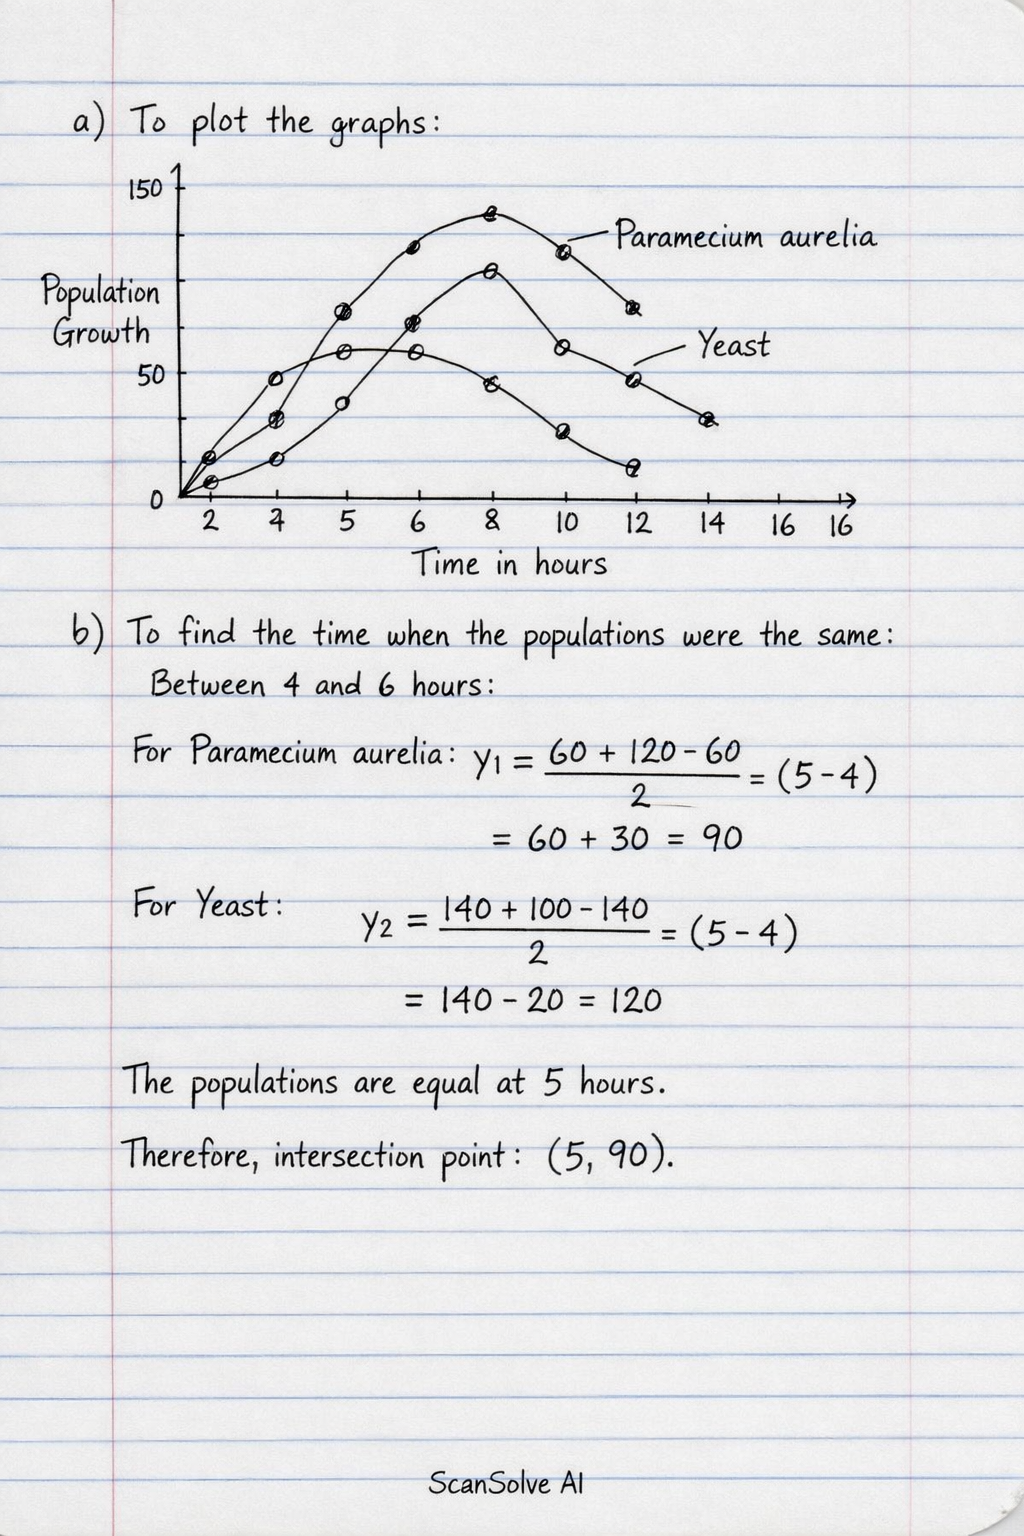
a) To plot the graphs: • Draw a graph with the x-axis labeled "Time in hours" (from 0 to 16 hours) and the y-axis labeled "Population growth" (from 0 to 150). • Plot the data points for Paramecium aurelia (2, 20), (4, 60), (6, 120), (8, 95), (10, 50), (12, 20), (14, 40), (16, 60) and connect them to form a curve. • Plot the data points for Yeast (2, 90), (4, 140), (6, 100), (8, 65), (10, 25), (12, 40), (14, 80), (16, 100) and connect them to form a second curve on the same axes. b) To find the time when the populations were the same, we look for an intersection point on the graph or interpolate between data points where the populations cross. Between 4 and 6 hours: