VGS (V) 0 -1 -2 -3 -4 ID (mA) 12 6.75 3.0 0.75 0 Plot: Parabolic curve from (0 V, 12 mA) to (–4 V, 0 mA).

English

ScanSolve AI Answer

Answer

12 mA\text{12 mA}

-4 V\text{-4 V}

Step-by-step solution

4 steps

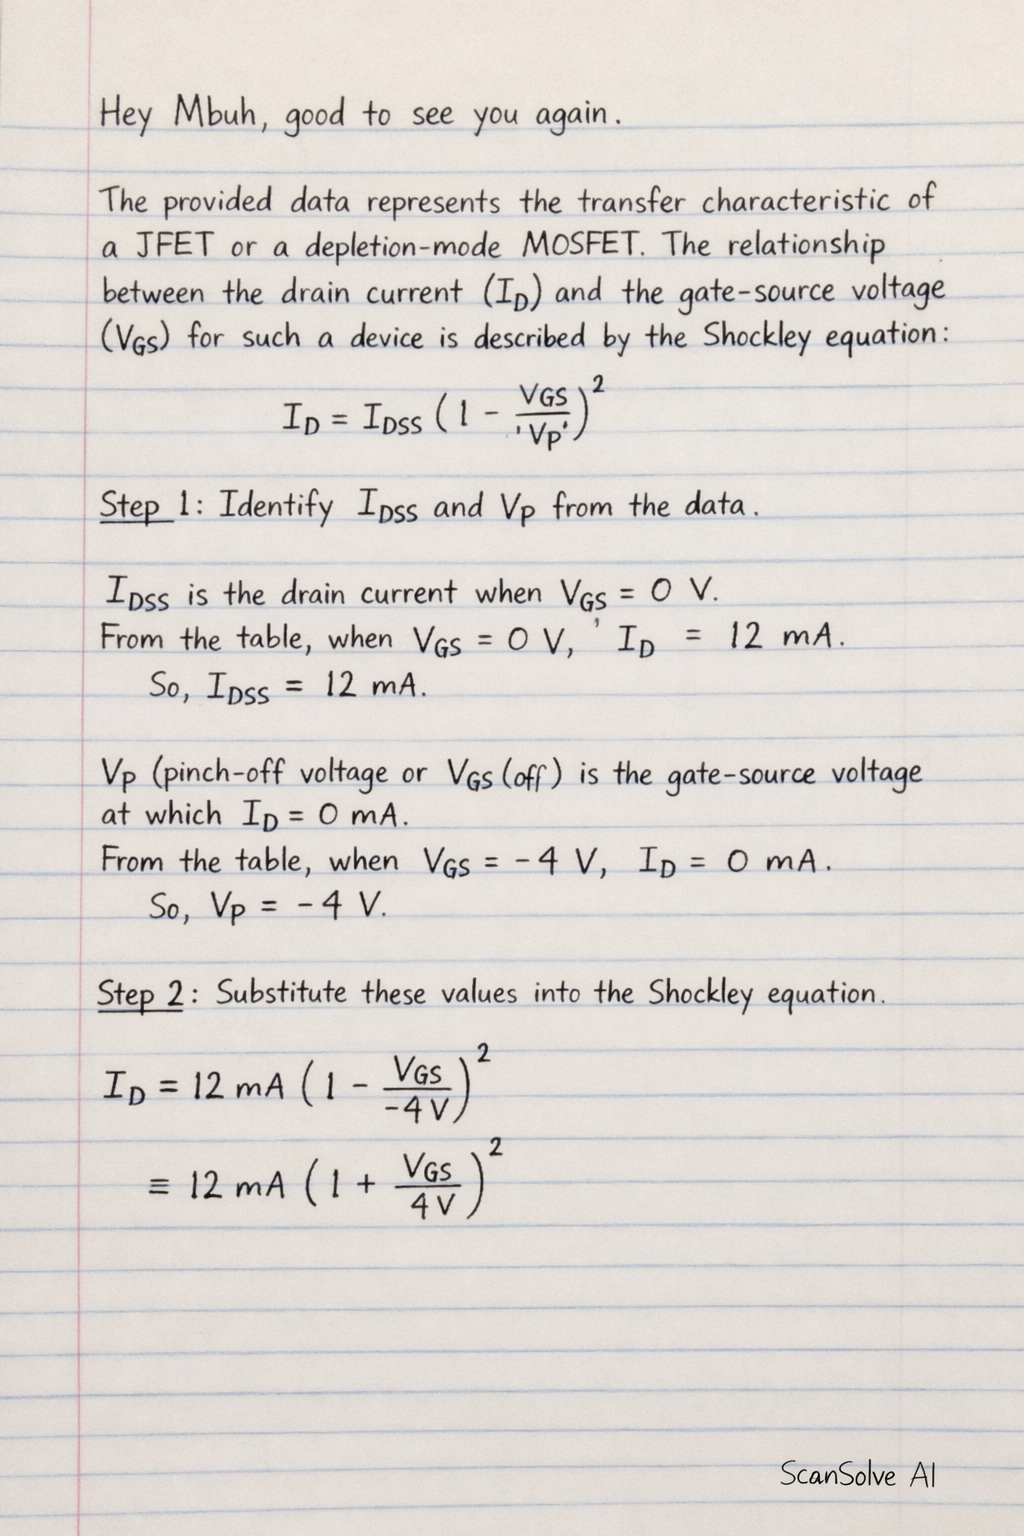
The provided data represents the transfer characteristic of a JFET or a depletion-mode MOSFET. The relationship between the drain current (IDI_D) and the gate-source voltage (VGSV_{GS}) for such a device is described by the Shockley equation:

ID=IDSS(1−VGSVP)2I_D = I_{DSS} \left(1 - \frac{V_{GS}}{V_P}\right)^2
  1. Identify IDSSI_{DSS} and VPV_P from the data.

    IDSSI_{DSS} is the drain current when VGS=0V_{GS} = 0 V. From the table, when VGS=0V_{GS} = 0 V, ID=12I_D = 12 mA.
    So, IDSS=12 mAI_{DSS} = 12 \text{ mA}.

    VPV_P (pinch-off voltage or VGS(off)V_{GS(off)}) is the gate-source voltage at which ID=0I_D = 0 mA. From the table, when VGS=−4V_{GS} = -4 V, ID=0I_D = 0 mA.
    So, VP=−4 VV_P = -4 \text{ V}.

  2. Substitute these values into the Shockley equation.

    ID=12 mA(1−VGS−4 V)2=12 mA(1+VGS4 V)2I_D = 12 \text{ mA} \left(1 - \frac{V_{GS}}{-4 \text{ V}}\right)^2 = 12 \text{ mA} \left(1 + \frac{V_{GS}}{4 \text{ V}}\right)^2
  3. Verify the given data points using this equation.

    • For VGS=−1V_{GS} = -1 V:
    ID=12 mA(1+−14)2=12 mA(0.75)2=12 mA×0.5625=6.75 mAI_D = 12 \text{ mA} \left(1 + \frac{-1}{4}\right)^2 = 12 \text{ mA} \left(0.75\right)^2 = 12 \text{ mA} \times 0.5625 = 6.75 \text{ mA}
    • For VGS=−2V_{GS} = -2 V:
    ID=12 mA(1+−24)2=12 mA(0.5)2=12 mA×0.25=3.0 mAI_D = 12 \text{ mA} \left(1 + \frac{-2}{4}\right)^2 = 12 \text{ mA} \left(0.5\right)^2 = 12 \text{ mA} \times 0.25 = 3.0 \text{ mA}
    • For VGS=−3V_{GS} = -3 V:
    ID=12 mA(1+−34)2=12 mA(0.25)2=12 mA×0.0625=0.75 mAI_D = 12 \text{ mA} \left(1 + \frac{-3}{4}\right)^2 = 12 \text{ mA} \left(0.25\right)^2 = 12 \text{ mA} \times 0.0625 = 0.75 \text{ mA}

    All calculated values match the provided data.

  4. Confirm the plot description.

    The equation ID=IDSS(1−VGSVP)2I_D = I_{DSS} \left(1 - \frac{V_{GS}}{V_P}\right)^2 describes a parabolic curve. The data points confirm this parabolic relationship, starting from (VGS,ID)=(0 V,12 mA)(V_{GS}, I_D) = (0 \text{ V}, 12 \text{ mA}) and ending at (−4 V,0 mA)(-4 \text{ V}, 0 \text{ mA}).

    The plot description is consistent with the provided data and the characteristics of a JFET/depletion-mode MOSFET.
    The key parameters are:

    • Drain-Source Saturation Current (IDSSI_{DSS}): 12 mA\boxed{\text{12 mA}}
    • Pinch-off Voltage (VPV_P or VGS(off)V_{GS(off)}): -4 V\boxed{\text{-4 V}}
Was this helpful?

Try one yourself

A new problem that tests the same skill.

Still stuck on this one?

Ask a follow-up, and the answer starts from this question.

Got a different question?Ask your own question
Handwritten step-by-step solution preview

Handwritten Step-by-Step Solution

Get this as a handwritten image on WhatsApp — like a tutor wrote it for you.

Try on WhatsApp