
This geography problem is solved step by step below, with detailed explanations to help you understand the method and arrive at the correct answer.
ScanSolve AI Answer
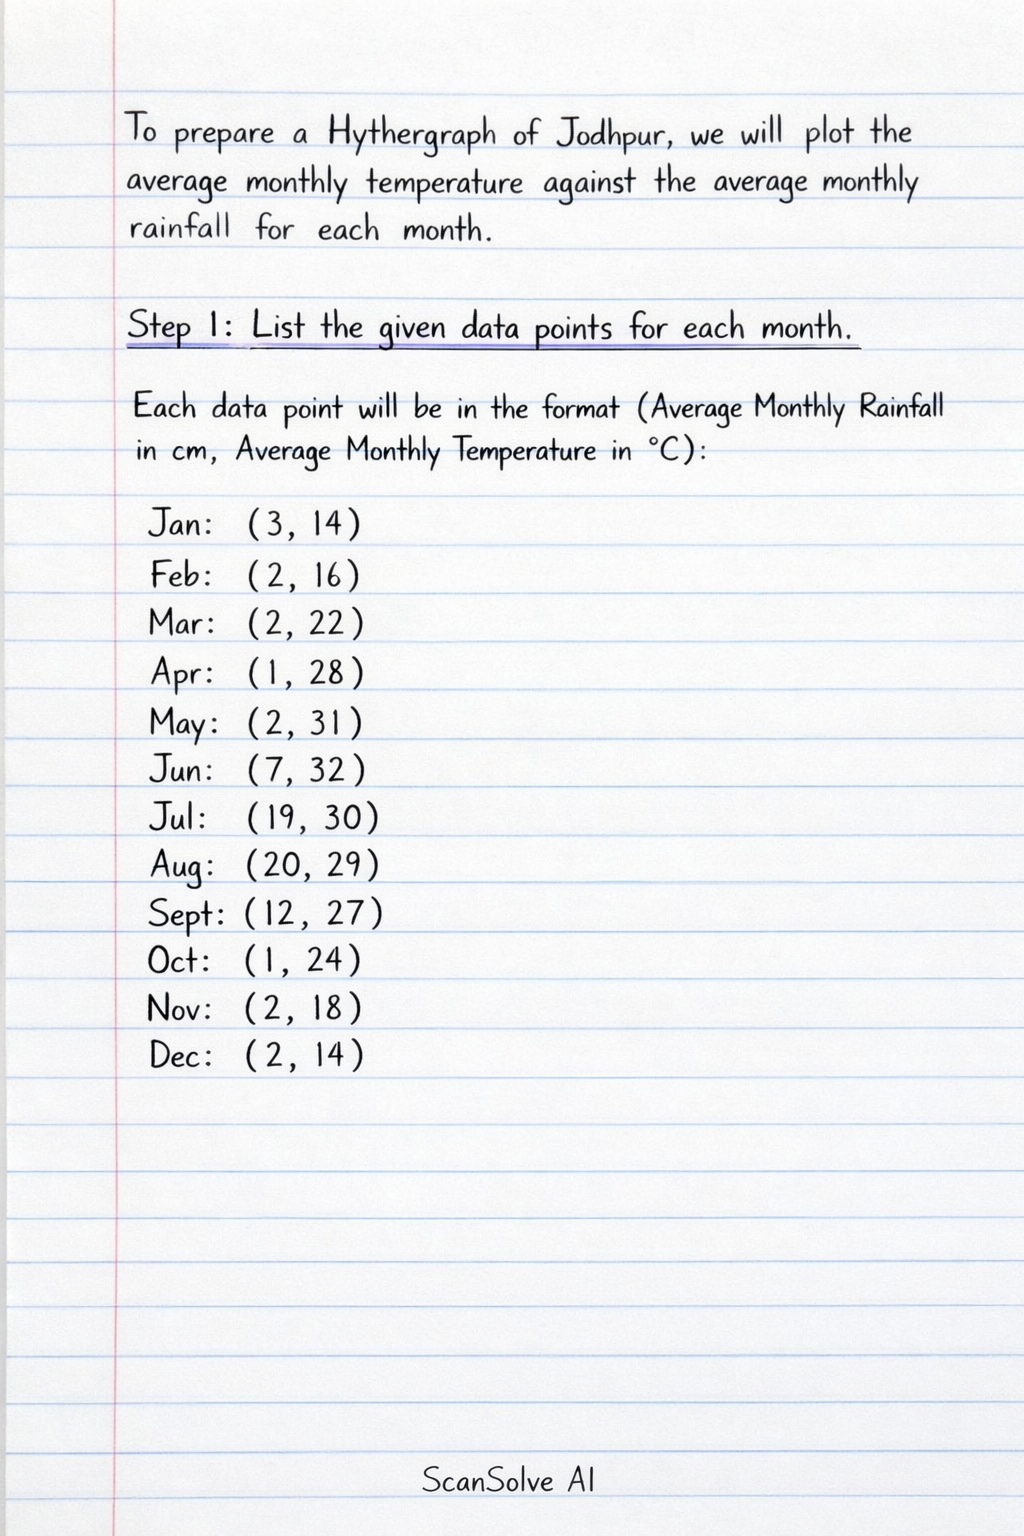
To prepare a Hythergraph of Jodhpur, we will plot the average monthly temperature against the average monthly rainfall for each month. Step 1: List the given data points for each month. Each data point will be in the format (Average Monthly Rainfall in cm, Average Monthly Temperature in ^C). • January (Jan): (3, 14) • February (Feb): (2, 16) • March (Mar): (2, 22) • April (Apr): (1, 28) • May (May): (2, 31) • June (Jun): (7, 32) • July (Jul): (19, 30) • August (Aug): (20, 29) • September (Sept): (12, 27) • October (Oct): (1, 24) • November (Nov): (2, 18) • December (Dec): (2, 14) Step 2: Set up the axes for the Hythergraph. 1. Draw a horizontal axis (X-axis) to represent Average Monthly Rainfall in cm. The rainfall values range from 1 cm to 20 cm. A suitable scale would be from 0 cm to 25 cm. 2. Draw a vertical axis (Y-axis) to represent Average Monthly Temperature in ^C. The temperature values range from 14^ to 32^. A suitable scale would be from 10^ to 35^. Step 3: Plot the points and draw the Hythergraph. 1. Plot each monthly data point (Rainfall, Temperature) on the graph. 2. Label each plotted point with the initial of the corresponding month (e.g., 'J' for January, 'F' for February, etc.). 3. Connect the plotted points in chronological order, starting from January, then February, March, and so on, up to December. 4. Finally, connect the December point back to the January point to complete the annual cycle, forming a closed polygon. 5. Add a title to the graph: "Hythergraph of Jodhpur". This process will create a visual representation showing the annual climatic conditions of Jodhpur in terms of temperature and rainfall. Last free one today — make it count tomorrow, or type /upgrade for unlimited.