
Time: 2 Hours 30 Minutes Instructions Answer Question 1 and any other three questions. Credit will be given for clear diagrams and illustrations where necessary. Show all workings. SECTION A (Compulsory) Question 1 — Demand and Supply The table below shows the weekly demand and supply schedules for oranges in Douala market. Price (FCFA) Quantity Demanded (kg) Quantity Supplied (kg) 100 90 10 200 80 20 300 70 30 400 60 40 500 50 50 600 40 60 700 30 70 800 20 80 Questions a) Define: i. Demand ii. Supply (4 marks) b) Plot the demand and supply curves on the same graph. (8 marks) Use the graph to determine: i. Equilibrium price ii. Equilibrium quantity (4 marks) c) Explain why the demand curve slopes downward. (4 marks) d) State and explain two factors that can cause a shift in the supply curve. (4 marks) e) Distinguish between: i. Extension of demand ii. Increase in demand (2 marks) SECTION B Question 2 — Elasticity of Demand a) Define price elasticity of demand. (2 marks) b) Distinguish between: i. Elastic demand ii. Inelastic demand (4 marks) c) Explain four factors that determine the elasticity of demand for a commodity. (8 marks) d) State three importance of elasticity of demand to producers or government. (6 marks) Question 3 — Population Growth a) Define: i. Population census ii. Population density (4 marks) b) Explain four causes of rapid population growth in developing countries. (8 marks) c) Describe three problems associated with overpopulation. (6 marks) d) State two advantages of population census. (2 marks) Question 4 — Migration and Urbanization a) What is migration? (2 marks) b) Distinguish between: i. Immigration ii. Emigration (4 marks) c) Explain four causes of rural-urban migration. (8 marks) d) Describe three effects of rural-urban migration on urban centers. (6 marks) Question 5 — Demand and Supply Analysis a) State the law of demand. (2 marks) b) Explain five determinants of demand. (10 marks) c) Explain four determinants of supply. (8 marks) Question 6 — Population Structure Study the information below carefully. A country has: High birth rate Falling death rate Large number of youths Increasing dependency ratio Questions a) Identify the type of population structure described above. (2 marks) b) Explain four problems faced by such a population. (8 marks) c) Suggest five measures that can reduce rapid population growth. (10 marks) Question 7 — Market Equilibrium a) What is market equilibrium? (2 marks) b) Explain how equilibrium price is determined in a market. (6 marks) c) With the aid of diagrams, explain: i. Excess demand ii. Excess supply (8 marks) d) State four assumptions of the law of demand. (4 marks) Question 8 — Population Policies a) What is a population policy? (2 marks) b) Explain four objectives of population policy. (8 marks) c) Describe five problems encountered in conducting a population census in developing countries. (10 marks) Diagram Reminder Demand and supply equilibrium may be illustrated below:
ScanSolve AI Answer
Answers
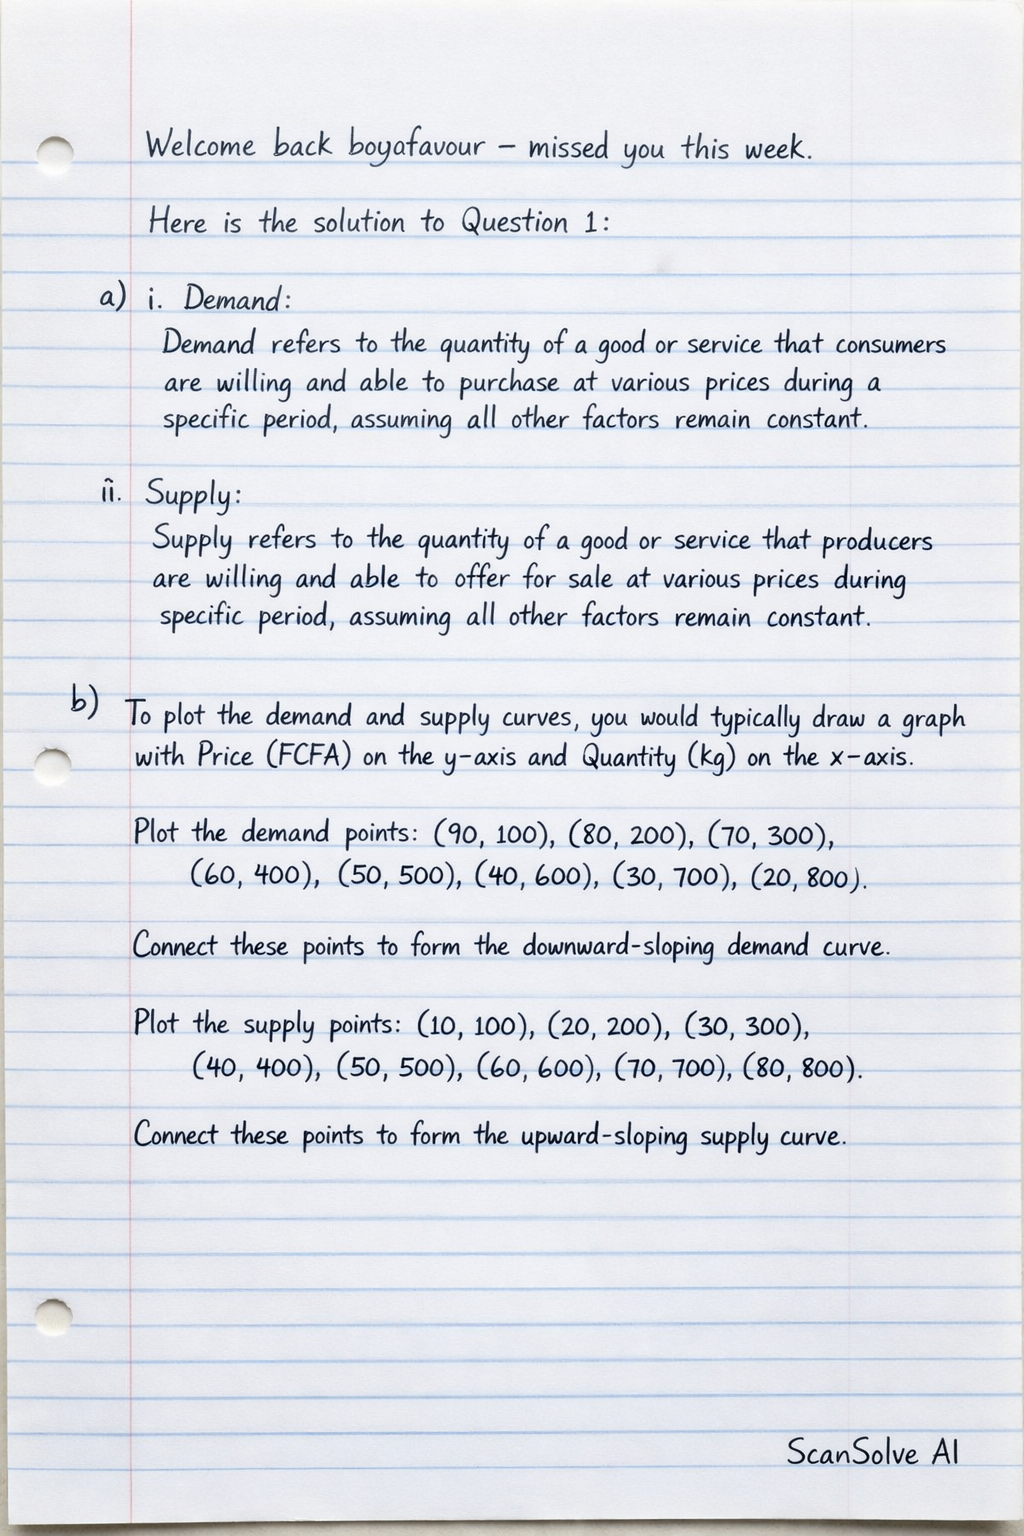
2 partsHere is the solution to Question 1:
a)
i. Demand: Demand refers to the quantity of a good or service that consumers are willing and able to purchase at various prices during a specific period, assuming all other factors remain constant.
ii. Supply: Supply refers to the quantity of a good or service that producers are willing and able to offer for sale at various prices during a specific period, assuming all other factors remain constant.
b)
To plot the demand and supply curves, you would typically draw a graph with Price (FCFA) on the y-axis and Quantity (kg) on the x-axis.
Plot the demand points: (90, 100), (80, 200), (70, 300), (60, 400), (50, 500), (40, 600), (30, 700), (20, 800). Connect these points to form the downward-sloping demand curve.
Plot the supply points: (10, 100), (20, 200), (30, 300), (40, 400), (50, 500), (60, 600), (70, 700), (80, 800). Connect these points to form the upward-sloping supply curve.
Using the graph (or the table where quantity demanded equals quantity supplied):
i. Equilibrium price: The equilibrium price is where the demand and supply curves intersect. From the table, this occurs when quantity demanded equals quantity supplied.
ii. Equilibrium quantity: The equilibrium quantity is the quantity at which the demand and supply curves intersect.
c)
The demand curve slopes downward primarily due to the Law of Demand, which states that, ceteris paribus (all else being equal), as the price of a good increases, the quantity demanded decreases, and vice versa. This relationship is explained by the income effect (consumers can buy more when prices fall, increasing their real income), the substitution effect (consumers switch to cheaper alternatives when a good's price rises), and the law of diminishing marginal utility (each additional unit consumed provides less satisfaction, so consumers are only willing to buy more at lower prices).
d)
Two factors that can cause a shift in the supply curve are:
- Changes in the cost of production: If the cost of inputs (like raw materials, labor, or energy) increases, producers will find it more expensive to produce the same quantity. This will lead them to supply less at every given price, causing the supply curve to shift to the left. Conversely, a decrease in production costs would shift the supply curve to the right.
- Technological advancements: Improvements in technology can make production processes more efficient, reducing the cost per unit and allowing producers to supply more goods at each price level. This leads to an increase in supply, shifting the supply curve to the right.
e)
i. Extension of demand: This refers to an increase in the quantity demanded of a good solely due to a fall in its own price. It is represented by a movement downward along the existing demand curve.
ii. Increase in demand: This refers to an increase in the quantity demanded of a good at every given price, caused by a change in a non-price factor (e.g., an increase in consumer income, a change in tastes, or an increase in the price of a substitute good). It is represented by a rightward shift of the entire demand curve.
Try one yourself
A new problem that tests the same skill.
Still stuck on this one?
Ask a follow-up, and the answer starts from this question.
More History Questions
Handwritten Step-by-Step Solution
Get this as a handwritten image on WhatsApp — like a tutor wrote it for you.
Try on WhatsApp