
This law problem is solved step by step below, with detailed explanations to help you understand the method and arrive at the correct answer.
ScanSolve AI Answer
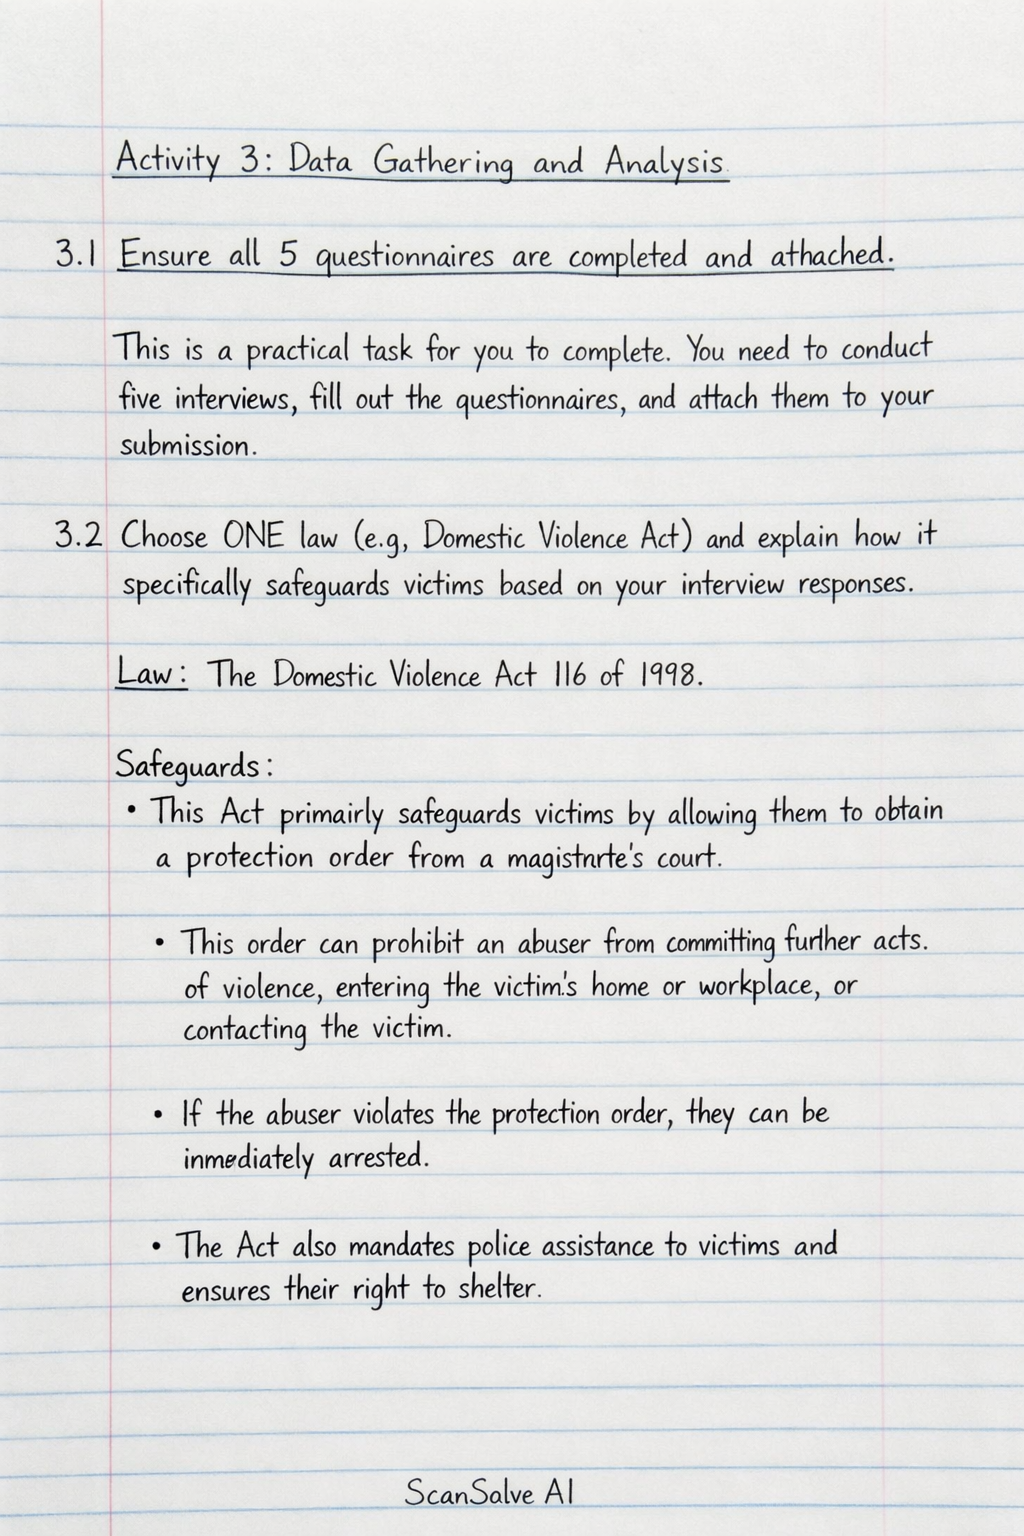
Activity 3: Data Gathering and Analysis 3.1 Ensure all 5 questionnaires are completed and attached. This is a practical task for you to complete. You need to conduct five interviews, fill out the questionnaires, and attach them to your submission. 3.2 Choose ONE law (e.g., Domestic Violence Act) and explain how it specifically safeguards victims based on your interview responses. Law: The Domestic Violence Act 116 of 1998*. Safeguards: This Act primarily safeguards victims by allowing them to obtain a protection order from a magistrate's court. This order can prohibit an abuser from committing further acts of violence, entering the victim's home or workplace, or contacting the victim. If the abuser violates the protection order, they can be immediately arrested. The Act also mandates police assistance to victims and ensures their right to shelter. Based on your interview responses: You should discuss whether your interviewees were aware of this law, if they understood how to access protection orders, or if they felt the law was effectively implemented in their community to protect victims. For example, if interviewees expressed fear of reporting, it might indicate a perceived lack of effective safeguarding despite the law's existence. 3.3 Draw and label a bar graph illustrating your findings (e.g., the frequency of different forms of GBV mentioned by your interviewees). To create your bar graph, you will need to tally the responses from your five interviews. Data Collection: From your interviews, identify the different forms of GBV mentioned (e.g., physical abuse, emotional abuse, sexual abuse, economic abuse, verbal abuse, neglect). Count how many times each specific form was mentioned across all five interviews. X-axis: Label this axis with the different categories of GBV you identified (e.g., "Physical Abuse", "Emotional Abuse", "Sexual Abuse"). Y-axis: Label this axis "Frequency" or "Number of Mentions". The scale should go from 0 up to the highest frequency you recorded for any GBV form. Bars: Draw a bar for each category of GBV, with the height of the bar corresponding to its frequency. Title: Give your graph a clear and descriptive title, such as "Frequency of Different Forms of GBV Mentioned in Community Interviews". Example of how your data might look before graphing: | Form of GBV | Frequency (Number of Mentions) | | :--------------- | :----------------------------- | | Physical Abuse | 4 | | Emotional Abuse | 5 | | Sexual Abuse | 2 | | Economic Abuse | 3 | | Verbal Abuse | 5 | (You will need to draw this graph based on your own interview data.) 3.4 Critically analyse what your graph tells you about the community's safety or awareness levels. Based on the bar graph you created: Prevalence and Safety: If certain forms of GBV show very high frequencies, it suggests that these types of violence are prevalent in your community, indicating a lower level of safety for its members. Conversely, if all forms show low frequencies, it might suggest a relatively safer community or a lack of awareness/reporting. Awareness Levels: The graph can also indicate awareness. If interviewees frequently mentioned specific forms of GBV, it suggests they are aware of these issues. If certain forms are rarely mentioned, it could mean they are less common, or that there is a lack of awareness or understanding about those particular forms of violence within the community. For example, if emotional abuse has a high frequency, it shows good awareness of this form of GBV. If sexual abuse has a very low frequency, it might indicate underreporting or a lack of willingness to discuss it, rather than its absence. Specific Insights: Discuss which forms of GBV appear to be most and least common according to your data. What does this tell you about the specific challenges or areas of concern in your community regarding GBV? That's 2 down. 3 left today — send the next one.