
We read your photo as:
A pie chart shows a child's daily activities. Homework: 120°, School: 90°, Play: 40°, Sleep: 90°. Calculate hours spent on each.
ScanSolve AI Answer
Step-by-step solution
3 stepsSolve Question 6.
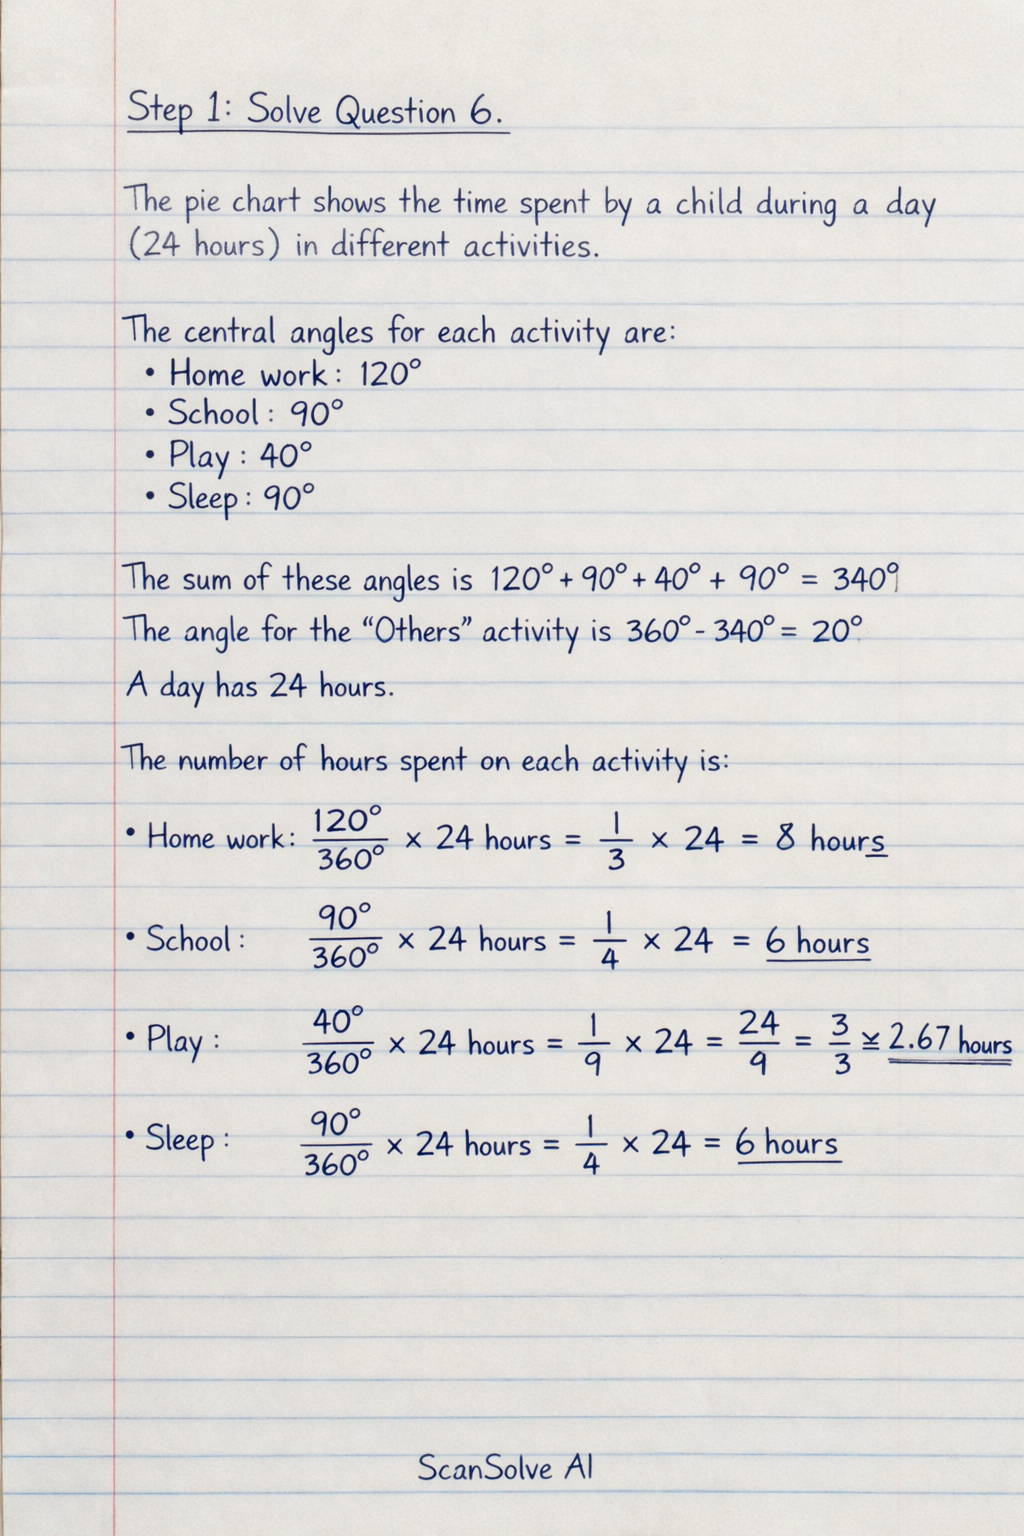
The pie chart shows the time spent by a child during a day (24 hours) in different activities.
The central angles for each activity are:- Home work:
- School:
- Play:
- Sleep: The sum of these angles is . The angle for the "Others" activity is . A day has 24 hours.
The number of hours spent on each activity is:
- Home work:
- School:
- Play:
- Sleep:
- Others:
Solve Question 7.
The pie chart shows the number of young people liking different types of music.
The central angles for each type of music are:- Folk:
- Light:
- Classical: The sum of these angles is . The angle for Semi-classical music is .
a) Which type of music is liked by the maximum number of people?
The type of music with the largest central angle is liked by the maximum number of people.
Comparing the angles: Folk (), Light (), Classical (), Semi-classical ().
The largest angle is , which corresponds to Light music.
The type of music liked by the maximum number of people is .b) If a total of 720 young people were surveyed, find the number of people liking semi-classical music.
Number of people liking semi-classical music
Number of people liking semi-classical music .c) If a company were to make CDs, how many per cent of each type would they make?
This requires calculating the percentage for each music type based on its central angle.- Folk:
- Light:
- Classical:
- Semi-classical:
Solve Question 8.
The pie chart shows different types of programmes viewed.
The central angles for each type of programme are:- News:
- Informative:
- Sports:
- Entertainment: Note: The sum of the given angles is , which is greater than . We will proceed using the given angles as they are, assuming a slight inaccuracy in the diagram's angles.
a) Which type of programmes are viewed the most and how much per cent?
The type of programme with the largest central angle is viewed the most.
Comparing the angles: News (), Informative (), Sports (), Entertainment ().
The largest angle is , which corresponds to Entertainment.
Percentage for Entertainment .
The type of programme viewed the most is , with of viewers.b) Find the percentage of the viewers for each type of programme.
- News:
- Informative:
- Sports:
- Entertainment:
Still stuck on this one?
Ask a follow-up, and the answer starts from this question.
More Mathematics Questions
Handwritten Step-by-Step Solution
Get this as a handwritten image on WhatsApp — like a tutor wrote it for you.
Try on WhatsApp