
We read your photo as:
Ann participated in a 20 km fun walk/run in London. Ann took two rest breaks during the walk/run. The graph below shows the distance covered by Ann against the time taken by her to complete the event:
ScanSolve AI Answer
Step-by-step solution
13 stepsI will now solve questions 2.4.1 to 2.4.7 based on the provided graph.
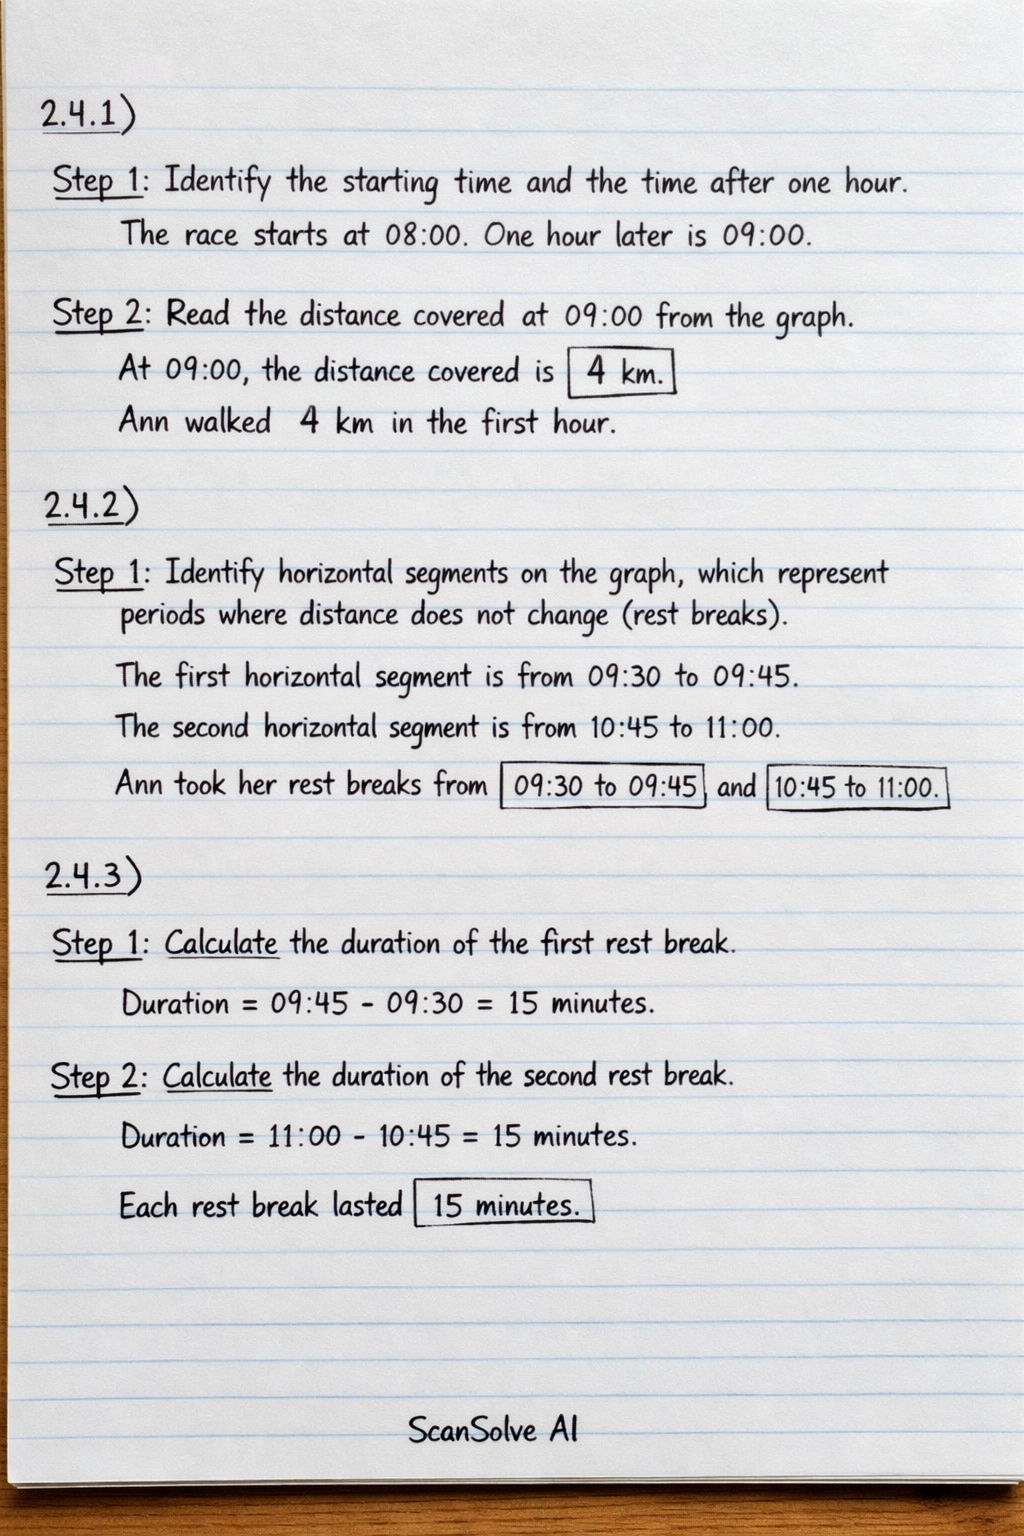
2.4.1)
Identify the starting time and the time after one hour.
The race starts at 08:00. One hour later is 09:00.
Read the distance covered at 09:00 from the graph.
At 09:00, the distance covered is .
Ann walked in the first hour.2.4.2)
Identify horizontal segments on the graph, which represent periods where distance does not change (rest breaks).
The first horizontal segment is from 09:30 to 09:45.
The second horizontal segment is from 10:45 to 11:00.
Ann took her rest breaks from and from .2.4.3)
Calculate the duration of the first rest break.
Duration = .
Calculate the duration of the second rest break.
Duration = .
Each rest break lasted .2.4.4)
Locate on the 'Dist' (y-axis).
Trace horizontally from to the graph line, then vertically down to the 'Time of the day' (x-axis).
The graph line crosses between 11:15 and 11:30. It appears to be exactly halfway.
Ann reached the mark at approximately or .2.4.5)
Locate 10:00 on the 'Time of the day' (x-axis).
Trace vertically from 10:00 to the graph line, then horizontally to the 'Dist' (y-axis).
At 10:00, the distance covered is .
Ann had walked by 10:00.2.4.6)
Identify the total distance of the race.
The race is .
Locate on the 'Dist' (y-axis) and find the corresponding time on the graph.
The graph ends at at 12:00.
Calculate the total time taken to complete the race.
Start time = 08:00. Finish time = 12:00.
Total time = .
Ann took to complete the race.2.4.7)
Identify the race start time in London from the graph.
The race started at 08:00 in London.
The information about South Africa time being two hours ahead is extra and not needed to answer the question about the time in London.
The time in London when the race started was .
Still stuck on this one?
Ask a follow-up, and the answer starts from this question.
More Mathematics Questions
Handwritten Step-by-Step Solution
Get this as a handwritten image on WhatsApp — like a tutor wrote it for you.
Try on WhatsApp