
We read your photo as:
Draw and label axes, set scale, and plot points A, B, C for a graph.
Mathematics
ScanSolve AI Answer
Here's a step-by-step solution for Question 2:
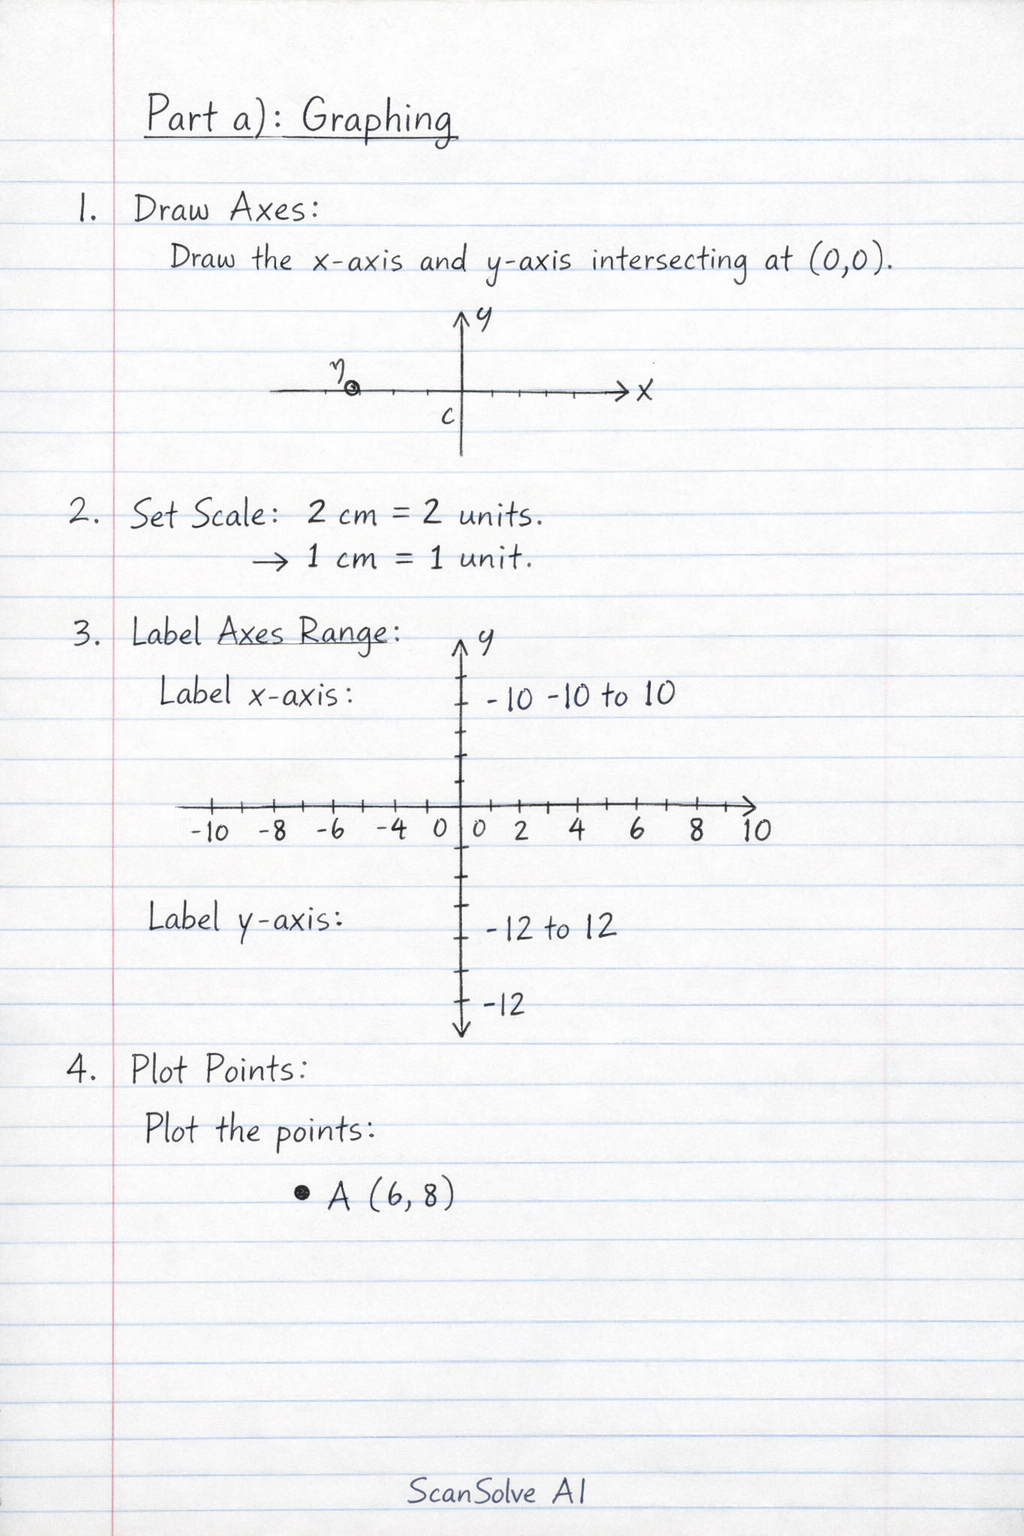
Part a): Graphing
- Draw Axes: Draw the horizontal x-axis (Ox) and the vertical y-axis (Oy) intersecting at the origin (0,0) on your graph sheet.
- Set Scale: Mark the axes such that 2 cm represents 2 units. This means each 1 cm grid line represents 1 unit.
- Label Axes Range:
- Label the x-axis from -10 to 10.
- Label the y-axis from -12 to 12.
- Plot Points: Plot the given points on the graph:
- A
Was this helpful?
Still stuck on this one?
Ask a follow-up, and the answer starts from this question.
Got a different question?Ask your own question
More Mathematics Questions
QQuestion 2, Part a) Graphing: Draw Axes, Set Scale, Label Axes Range, Plot Points.QHow do I draw a graph with the provided data points and scale?QPlot the points A(1,2), B(1,6), and C(5,5) on a Cartesian plane and draw triangle ABC.QFind the coordinates of points A, B, and C from the graph.QLocate points A, B, C and D in reference to the values along x and y axes. Discuss and share the…
Handwritten Step-by-Step Solution
Get this as a handwritten image on WhatsApp — like a tutor wrote it for you.
Try on WhatsApp