
This mathematics problem involves applying core mathematical principles and formulas. Below you will find a complete step-by-step solution with detailed explanations for each step, helping you understand not just the answer but the method behind it.
ScanSolve AI Answer
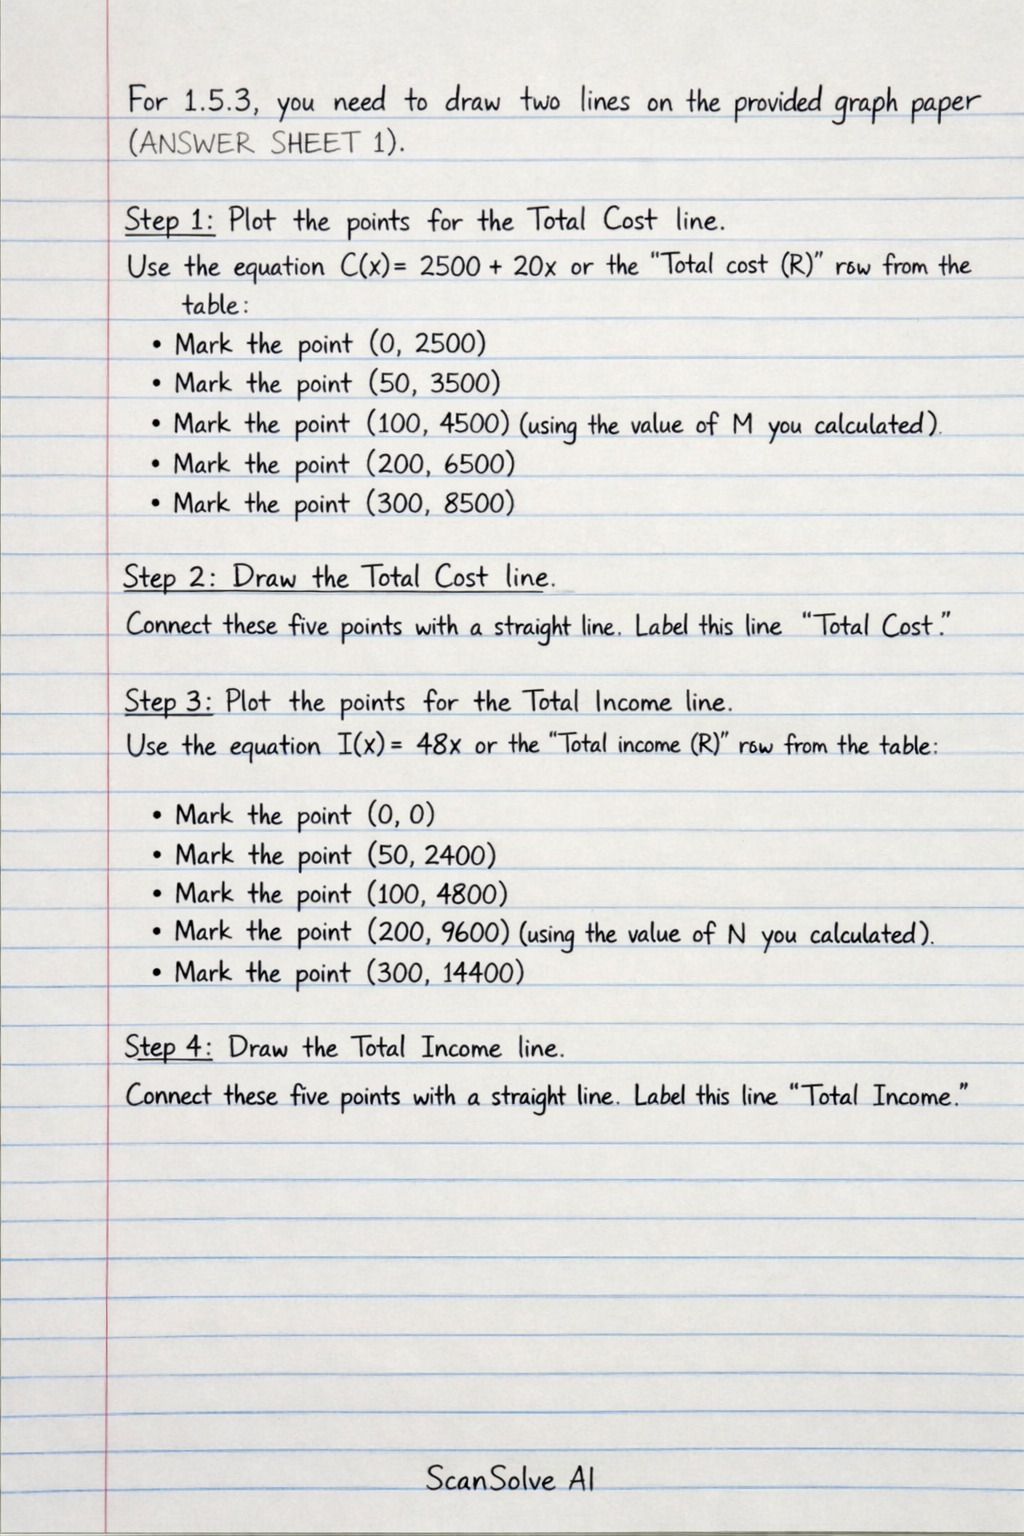
For 1.5.3, you need to draw two lines on the provided graph paper (ANSWER SHEET 1). Step 1: Plot the points for the Total Cost line. Use the equation C(x) = 2500 + 20x or the "Total cost (R)" row from the table. • Mark the point (0, 2500) • Mark the point (50, 3500) • Mark the point (100, 4500) (using the value of M you calculated) • Mark the point (200, 6500) • Mark the point (300, 8500) Step 2: Draw the Total Cost line. Connect these five points with a straight line. Label this line "Total Cost". Step 3: Plot the points for the Total Income line. Use the equation I(x) = 48x or the "Total income (R)" row from the table. • Mark the point (0, 0) • Mark the point (50, 2400) • Mark the point (100, 4800) • Mark the point (200, 9600) (using the value of N you calculated) • Mark the point (300, 14400) Step 4: Draw the Total Income line. Connect these five points with a straight line. Label this line "Total Income". The graph will show how the total cost and total income change with the number of dozens of scones sold. The point where these two lines intersect is the break-even point. That's 2 down. 3 left today — send the next one.