
We read your photo as:
Plot the graph for the equation y = 2x2 − 5x − 12 using the provided table of values.
ScanSolve AI Answer
Use the left and right arrow keys to trace the curve, up and down to jump between key points, and plus and minus to zoom.
| Point | x | y |
|---|---|---|
| x-intercept | −1.5 | 0 |
| y-intercept | 0 | −12 |
| Minimum | 1.25 | −15.12 |
| x-intercept | 4 | 0 |
Step-by-step solution
4 stepsI cannot physically draw the graph for you, but I can provide detailed instructions on how to draw it using the information from the previous steps.
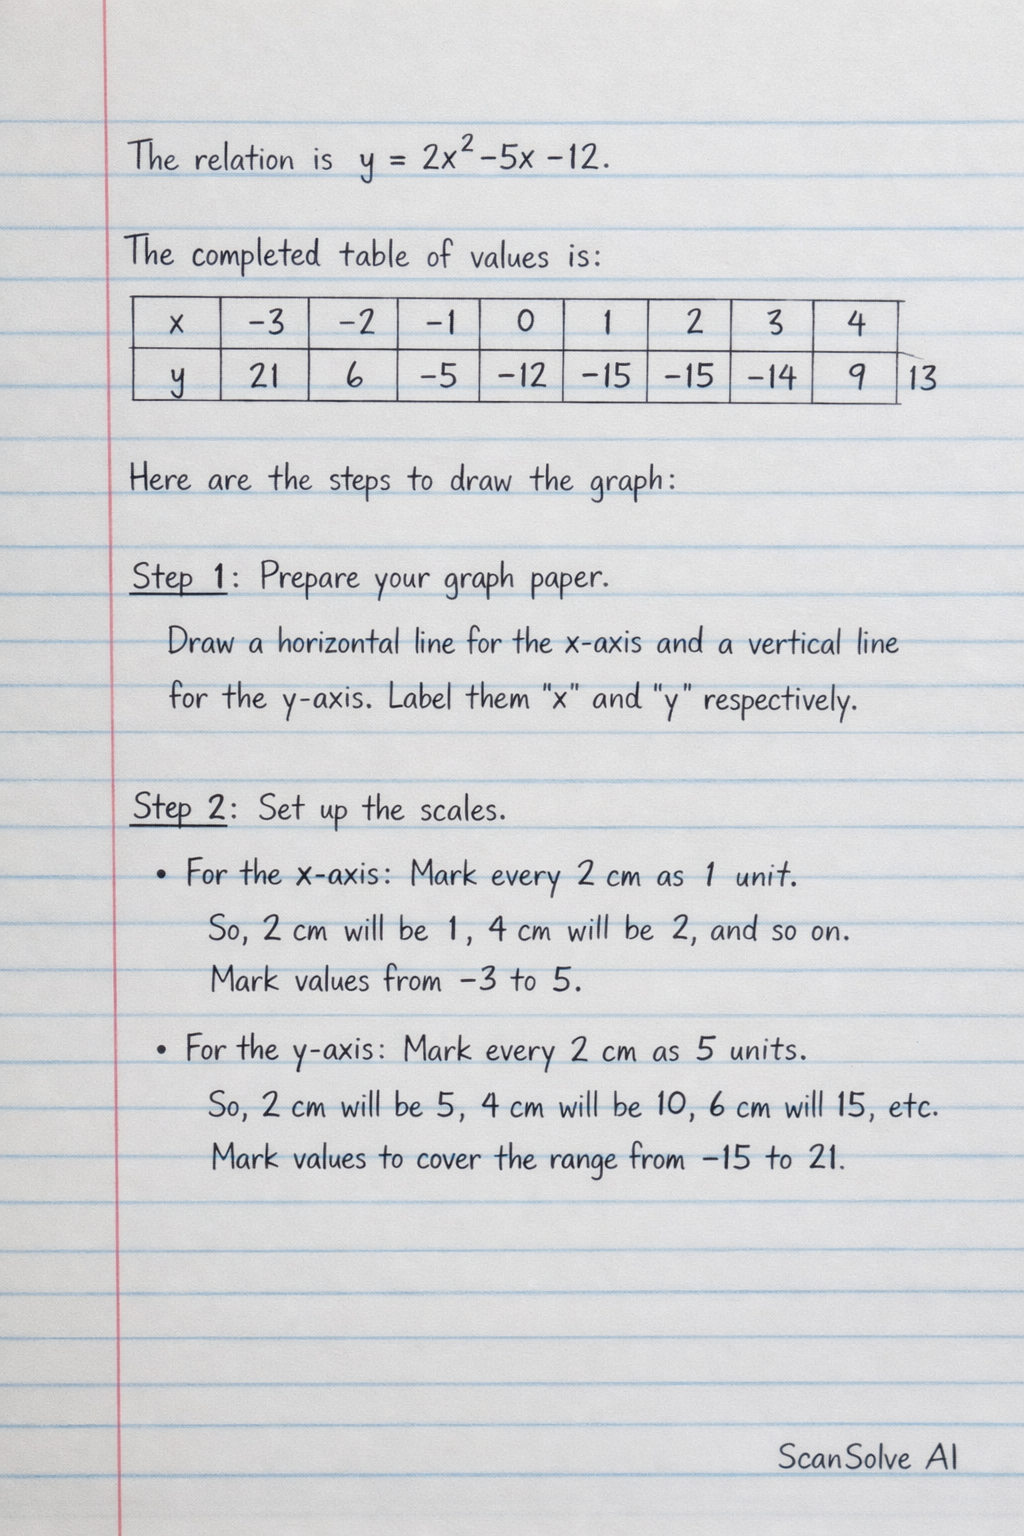
The relation is .
The completed table of values is:
| x | -3 | -2 | -1 | 0 | 1 | 2 | 3 | 4 | 5 |
|---|---|---|---|---|---|---|---|---|---|
| y | 21 | 6 | -5 | -12 | -15 | -14 | -9 | 0 | 13 |
Here are the steps to draw the graph:
Prepare your graph paper.
Draw a horizontal line for the x-axis and a vertical line for the y-axis. Label them 'x' and 'y' respectively.
Set up the scales.
- For the x-axis: Mark every 2 cm as 1 unit. So, 2 cm will be 1, 4 cm will be 2, and so on. Mark values from -3 to 5.
- For the y-axis: Mark every 2 cm as 5 units. So, 2 cm will be 5, 4 cm will be 10, 6 cm will be 15, etc. Mark values to cover the range from -15 to 21.
Plot the points from the table.
Carefully plot each (x, y) coordinate pair on your graph paper:
Draw the curve.
Once all points are plotted, draw a smooth curve that passes through all these points. This curve is the graph of the relation .
Still stuck on this one?
Ask a follow-up, and the answer starts from this question.
More Mathematics Questions
Handwritten Step-by-Step Solution
Get this as a handwritten image on WhatsApp — like a tutor wrote it for you.
Try on WhatsApp