

This mathematics problem involves applying core mathematical principles and formulas. Below you will find a complete step-by-step solution with detailed explanations for each step, helping you understand not just the answer but the method behind it.
ScanSolve AI Answer
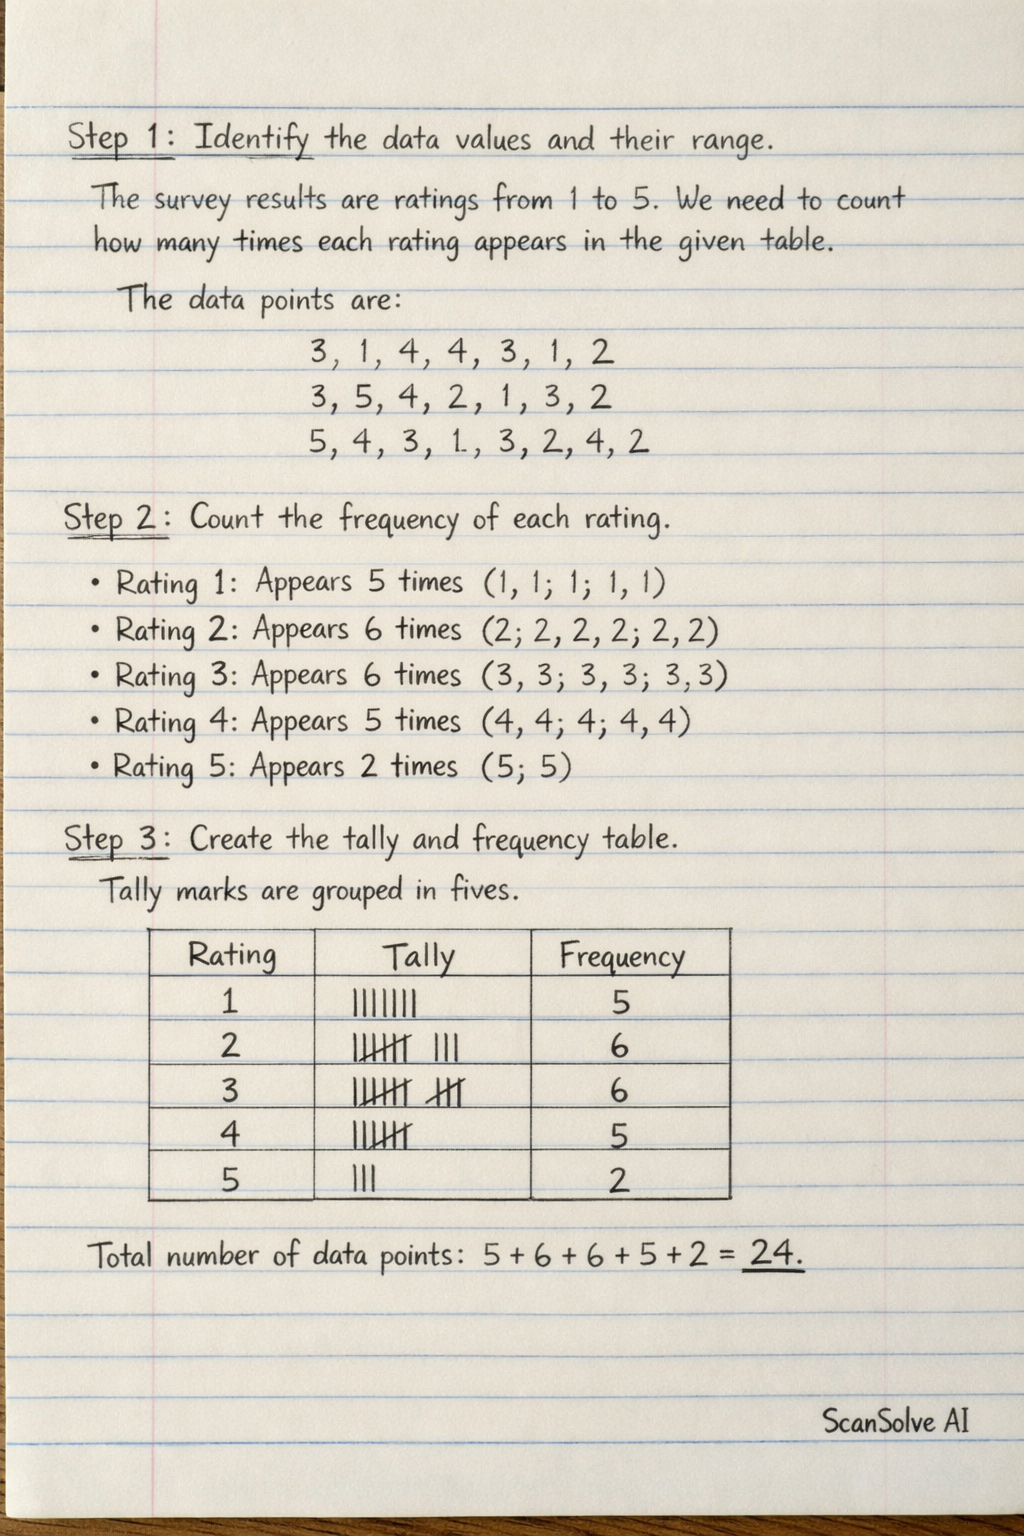
Step 1: Identify the data values and their range. The survey results are ratings from 1 to 5. We need to count how many times each rating appears in the given table. The data points are: 3, 1, 4, 4, 3, 1, 2 3, 5, 4, 2, 1, 2, 3, 2 5, 4, 3, 1, 3, 2, 4, 1, 2 Step 2: Count the frequency of each rating. • Rating 1: Appears 5 times (from R1: 1, 1; R2: 1; R3: 1, 1) • Rating 2: Appears 6 times (from R1: 2; R2: 2, 2, 2; R3: 2, 2) • Rating 3: Appears 6 times (from R1: 3, 3; R2: 3, 3; R3: 3, 3) • Rating 4: Appears 5 times (from R1: 4, 4; R2: 4; R3: 4, 4) • Rating 5: Appears 2 times (from R2: 5; R3: 5) Step 3: Create the tally and frequency table. We will represent each count with a tally mark, where every fifth mark is a diagonal line across the previous four. |c|c|c| Rating & Tally & Frequency \\ 1 & ||||| & 5 \\ 2 & ||||| | & 6 \\ 3 & ||||| | & 6 \\ 4 & ||||| & 5 \\ 5 & || & 2 \\ The total number of data points is 5+6+6+5+2 = 24. The final answer is The tally and frequency table is shown above.. Send me the next one 📸