
We read your photo as:
The cumulative frequency graph (ogive) shows the time taken (in minutes) for 60 employees to travel to work each morning. Estimate the median travel time.
ScanSolve AI Answer
Step-by-step solution
13 stepsHere's the solution to Question 2:
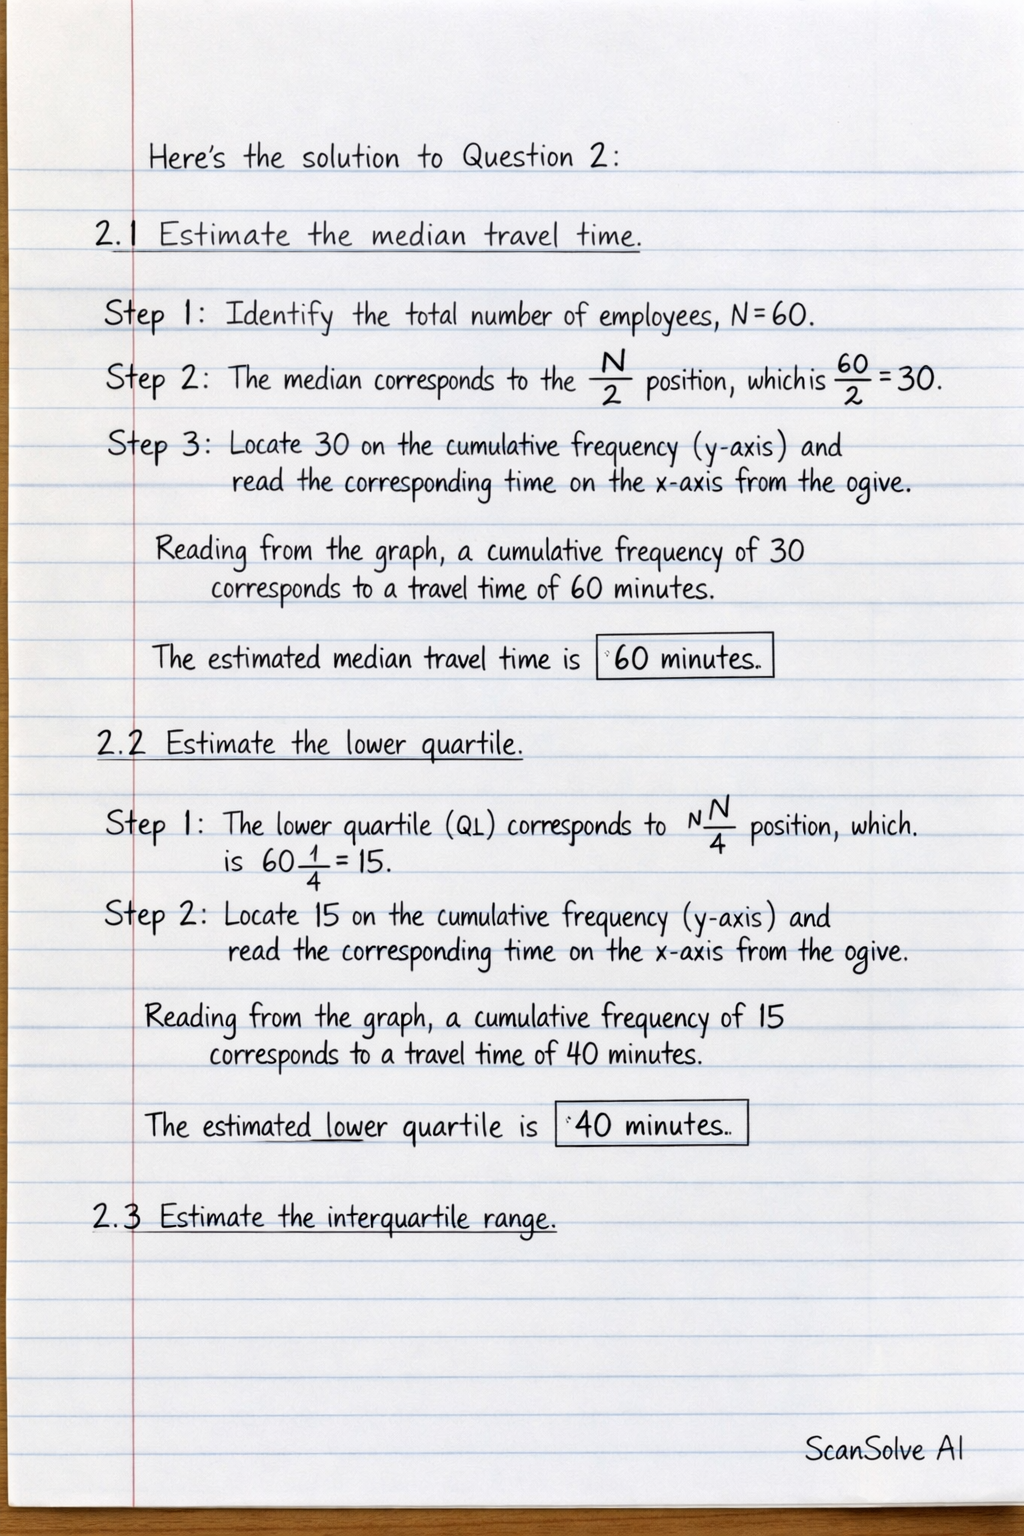
Part 2.1· 3 steps
Estimate the median travel time.
Identify the total number of employees, .
The median corresponds to the position, which is .
Locate 30 on the cumulative frequency (y-axis) and read the corresponding time on the x-axis from the ogive.
Reading from the graph, a cumulative frequency of 30 corresponds to a travel time of 60 minutes.
The estimated median travel time is .
Part 2.2· 2 steps
Estimate the lower quartile.
The lower quartile (Q1) corresponds to the position, which is .
Locate 15 on the cumulative frequency (y-axis) and read the corresponding time on the x-axis from the ogive.
Reading from the graph, a cumulative frequency of 15 corresponds to a travel time of 40 minutes.
The estimated lower quartile is .
Part 2.3· 3 steps
Estimate the interquartile range.
The upper quartile (Q3) corresponds to the position, which is .
Locate 45 on the cumulative frequency (y-axis) and read the corresponding time on the x-axis from the ogive.
Reading from the graph, a cumulative frequency of 45 corresponds to a travel time of 80 minutes.
Calculate the interquartile range (IQR) using the formula .
The estimated interquartile range is .
Part 2.4· 1 step
Draw a box and whisker diagram.
Determine the five-number summary for the box-whisker plot.
- Minimum time = 5 minutes (given)
- Lower Quartile (Q1) = 40 minutes (from 2.2)
- Median (Q2) = 60 minutes (from 2.1)
- Upper Quartile (Q3) = 80 minutes (from 2.3)
- Maximum time = 120 minutes (given)
To construct the box-whisker plot:
- Draw a number line (scaled line) that covers the range from 0 to 120 minutes.
- Mark the minimum value (5) and the maximum value (120) with whiskers.
- Draw a box from the first quartile (Q1 = 40) to the third quartile (Q3 = 80).
- Draw a vertical line inside the box at the median (Q2 = 60).
Part 2.5· 4 steps
What percentage of the employees will be allowed to work from home for part of the day?
Identify the threshold for working from home.
Employees who travel for an hour or more (60 minutes or more) are allowed to work from home.
Determine the number of employees who travel less than 60 minutes.
From the ogive, at 60 minutes on the x-axis, the cumulative frequency is 30. This means 30 employees travel 60 minutes or less.
Calculate the number of employees who travel more than 60 minutes.
Total employees = 60.
Number of employees travelling more than 60 minutes = Total employees - (Cumulative frequency at 60 minutes)Calculate the percentage of employees who will work from home.
The percentage of employees who will be allowed to work from home is .
Still stuck on this one?
Ask a follow-up, and the answer starts from this question.
More Mathematics Questions
Handwritten Step-by-Step Solution
Get this as a handwritten image on WhatsApp — like a tutor wrote it for you.
Try on WhatsApp