
We read your photo as:
This image displays a Risk Matrix, which is a tool used for risk assessment. It combines the Likelihood (or probability) of an event occurring with the Consequences (or severity) of that event t
Mathematics
ScanSolve AI Answer
Answer
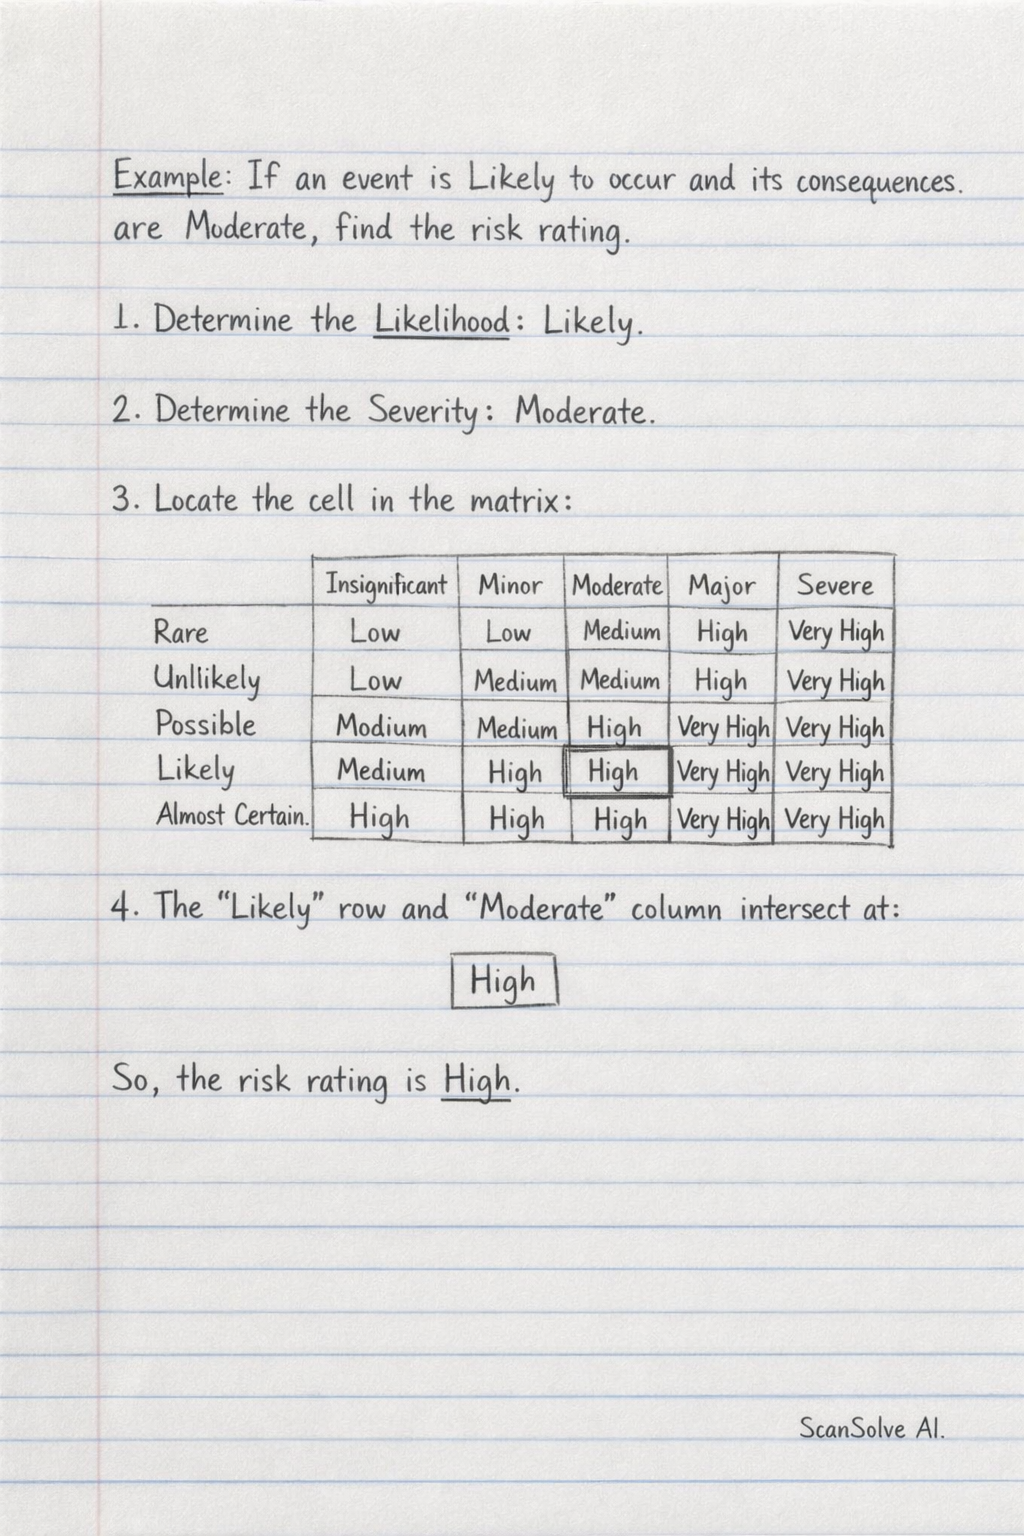
This image displays a Risk Matrix, which is a tool used for risk assessment. It combines the Likelihood (or probability) of an event occurring with the Consequences (or severity) of that event to determine an overall Risk Rating.
To use the matrix:
- Identify the Likelihood of the event from the vertical axis (Rare, Unlikely, Possible, Likely, Almost Certain).
- Identify the Severity of the consequences from the horizontal axis (Insignificant, Minor, Moderate, Major, Severe).
- Find the cell where the chosen likelihood row and severity column intersect. The value in this cell is the Risk Rating (Low, Medium, High, Very High).
For example, if an event is Likely to occur and its consequences are Moderate, the risk rating would be High.
Was this helpful?
Still stuck on this one?
Ask a follow-up, and the answer starts from this question.
Got a different question?Ask your own question
More Mathematics Questions
Handwritten Step-by-Step Solution
Get this as a handwritten image on WhatsApp — like a tutor wrote it for you.
Try on WhatsApp