
We read your photo as:
To identify the measure of spread that indicates the average distance of each data point from the mean.
Mathematics
ScanSolve AI Answer
Step-by-step solution
3 stepsThe question asks to identify the measure of spread that indicates the average distance of each data point from the mean.
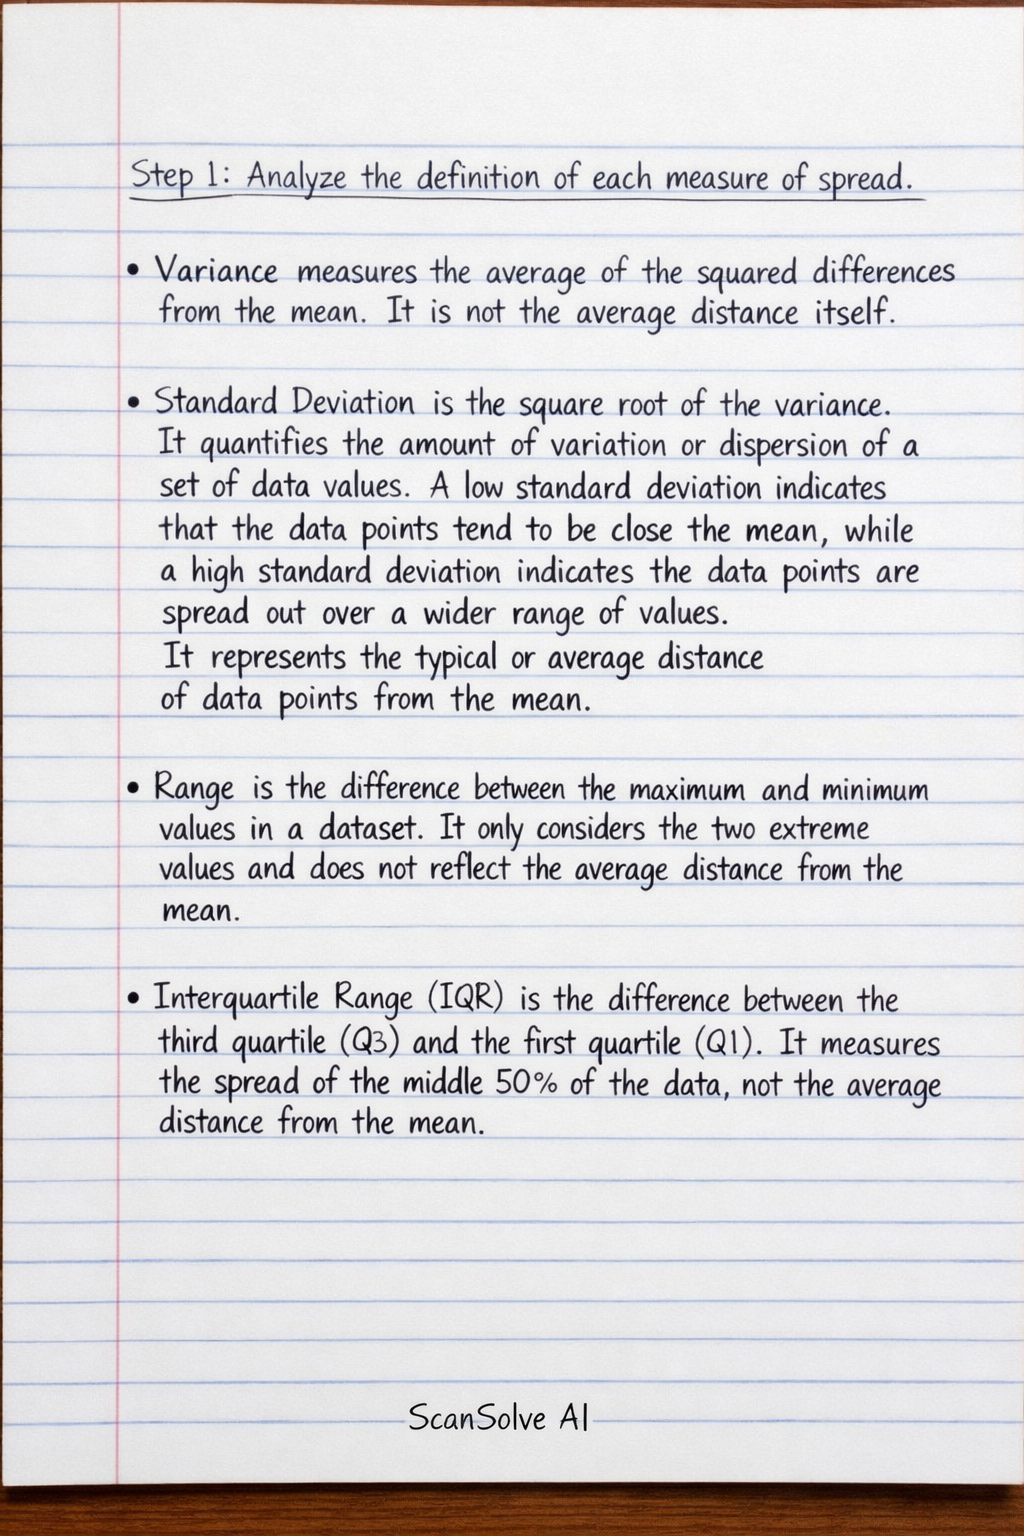
Analyze the definition of each measure of spread.
- Variance measures the average of the squared differences from the mean. It is not the average distance itself.
- Standard Deviation is the square root of the variance. It quantifies the amount of variation or dispersion of a set of data values. A low standard deviation indicates that the data points tend to be close to the mean, while a high standard deviation indicates that the data points are spread out over a wider range of values. It represents the typical or average distance of data points from the mean.
- Range is the difference between the maximum and minimum values in a dataset. It only considers the two extreme values and does not reflect the average distance from the mean.
- Interquartile Range (IQR) is the difference between the third quartile (Q3) and the first quartile (Q1). It measures the spread of the middle 50% of the data, not the average distance from the mean.
Relate the question to the provided Python code.
The Python code calculates
standard_deviation = np.std(data). The output is given as7.071067811865475. This explicitly shows that the code is calculating the standard deviation.Conclude based on the definition and the code.
The measure of spread that indicates the average distance of each data point from the mean is the Standard Deviation. The Python code also calculates the standard deviation.
The correct option is Standard Deviation.
Was this helpful?
Still stuck on this one?
Ask a follow-up, and the answer starts from this question.
Got a different question?Ask your own question
More Mathematics Questions
QCalculate the mean deviation from the mean of the distribution belowQCalculate the mean of the distribution.QCalculate the mean mark of the distribution (correct to one decimal place). Find the median mark…QCalculate the spread, range, and modal height using the provided student height data or frequency…QCalculate the mean (x) of the data set.
Browse by topic:Statistics
Handwritten Step-by-Step Solution
Get this as a handwritten image on WhatsApp — like a tutor wrote it for you.
Try on WhatsApp