
We read your photo as:
You recorded the minimum temperatures per day for the past month. The results are as follows: Group the data in six groups (six categories) and complete.
Mathematics
ScanSolve AI Answer
Step-by-step solution
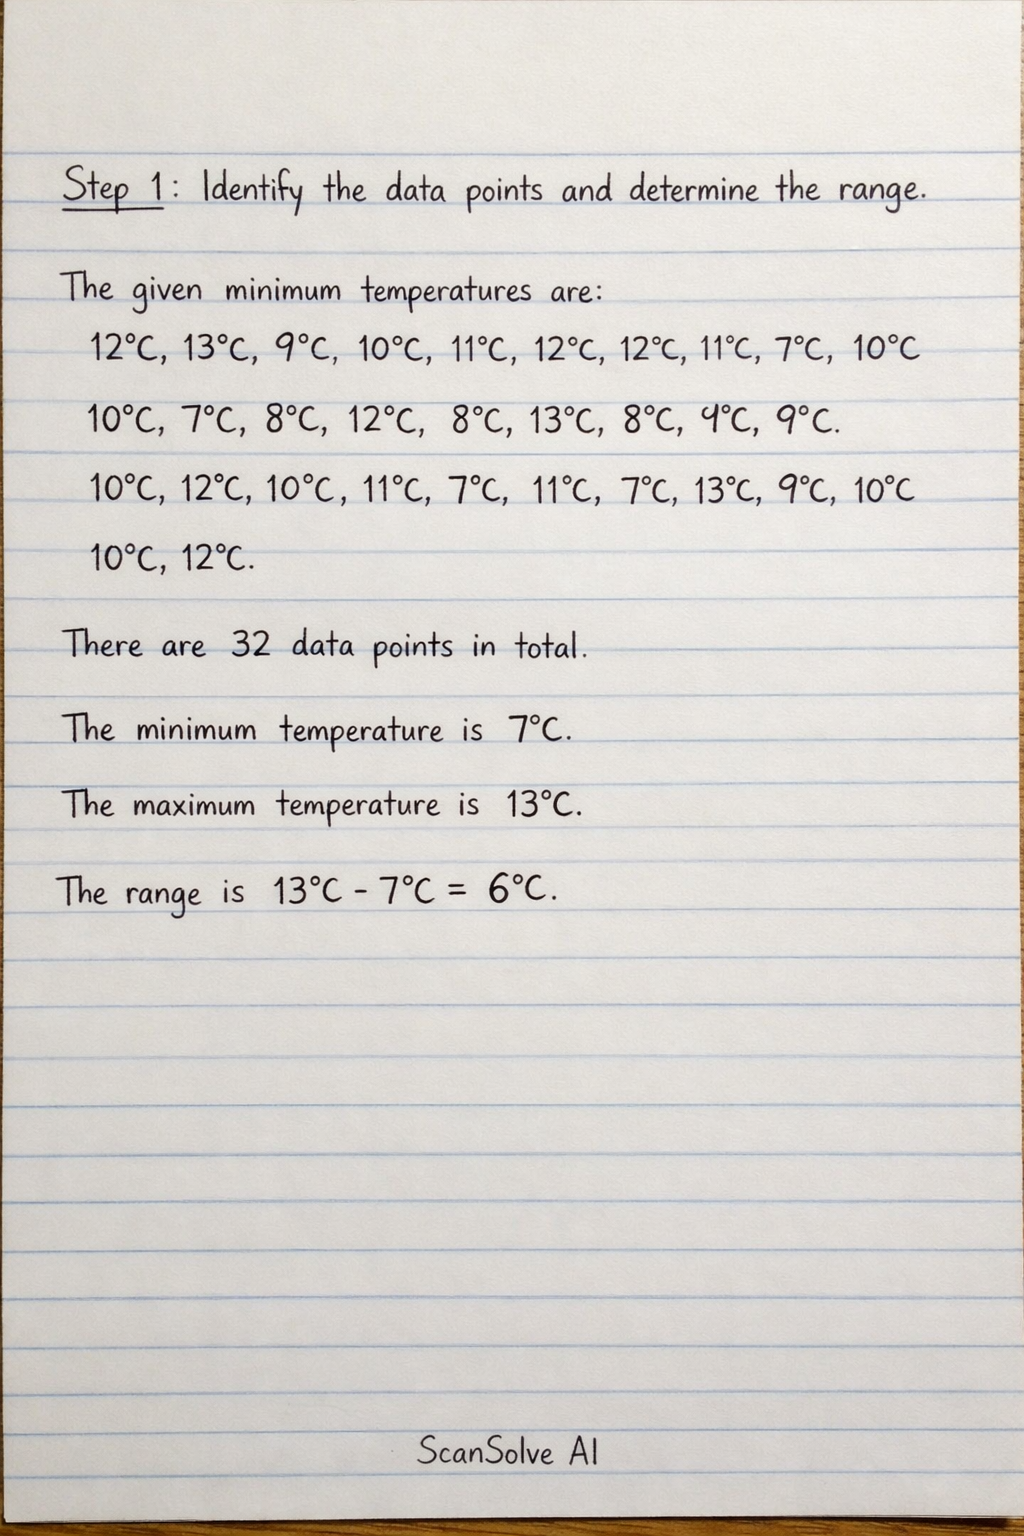
4 stepsIdentify the data points and determine the range.
The given minimum temperatures are:
There are 32 data points in total.
The minimum temperature is .
The maximum temperature is .
The range is .Define the six categories.
Since the range is and we need six categories, we can define categories with a width of . However, this would result in 7 distinct temperature values (). To fit into exactly six categories, we will group the highest two temperatures together.
The categories are:Tally the frequencies for each category.
- For : Count occurrences of 7. (4 times)
- For : Count occurrences of 8. (3 times)
- For : Count occurrences of 9. (5 times)
- For : Count occurrences of 10. (7 times)
- For : Count occurrences of 11. (5 times)
- For : Count occurrences of 12 and 13. (8 times)
Complete the frequency distribution table.
The total frequency is , which matches the total number of data points.
Was this helpful?
Still stuck on this one?
Ask a follow-up, and the answer starts from this question.
Got a different question?Ask your own question
More Mathematics Questions
QInterpret the provided data tables and graphs to answer questions about temperature and rainfall…QThe image contains a dataset of daily temperatures over a 100-day period and asks to calculate the…QDraw a line graph showing the maximum and minimum temperatures for a week using the provided data.QAverages of daily minimum and maximum temperatures for a week.QCalculate the mean rainfall for each month, given the following data:
Handwritten Step-by-Step Solution
Get this as a handwritten image on WhatsApp — like a tutor wrote it for you.
Try on WhatsApp