
We read your photo as:
The velocity-time (v-t) graph for an object travelling in a straight line is shown below. Which of the following is the corresponding acceleration-time (a-t) graph?
Physics
ScanSolve AI Answer
Answer
E
Step-by-step solution
3 stepsThe problem asks to identify the correct acceleration-time graph corresponding to the given velocity-time graph.
Analyze the given velocity-time (v-t) graph.
The v-t graph shows two distinct phases:
- Phase 1: From to some time (where the graph crosses the t-axis), the velocity decreases linearly from a positive value to zero. This indicates a constant negative slope.
- Phase 2: From time onwards, the velocity continues to decrease linearly from zero to a negative value. This also indicates a constant negative slope.
Relate velocity-time graph to acceleration-time graph.
Acceleration is the rate of change of velocity, which means it is the slope of the velocity-time graph.
- Since the v-t graph is a straight line with a constant negative slope throughout both phases, the acceleration must be constant and negative for the entire duration shown.
Evaluate the options.
We are looking for an acceleration-time (a-t) graph that shows a constant negative acceleration.
- Graph A shows positive acceleration, then negative acceleration.
- Graph B shows negative acceleration, then positive acceleration.
- Graph C shows linearly increasing acceleration, then linearly decreasing acceleration.
- Graph D shows acceleration that decreases linearly, then increases linearly.
- Graph E shows a constant negative acceleration.
Based on our analysis, Graph E correctly represents a constant negative acceleration.
The final answer is
Was this helpful?
Try one yourself
A new problem that tests the same skill.
Still stuck on this one?
Ask a follow-up, and the answer starts from this question.
Got a different question?Ask your own question
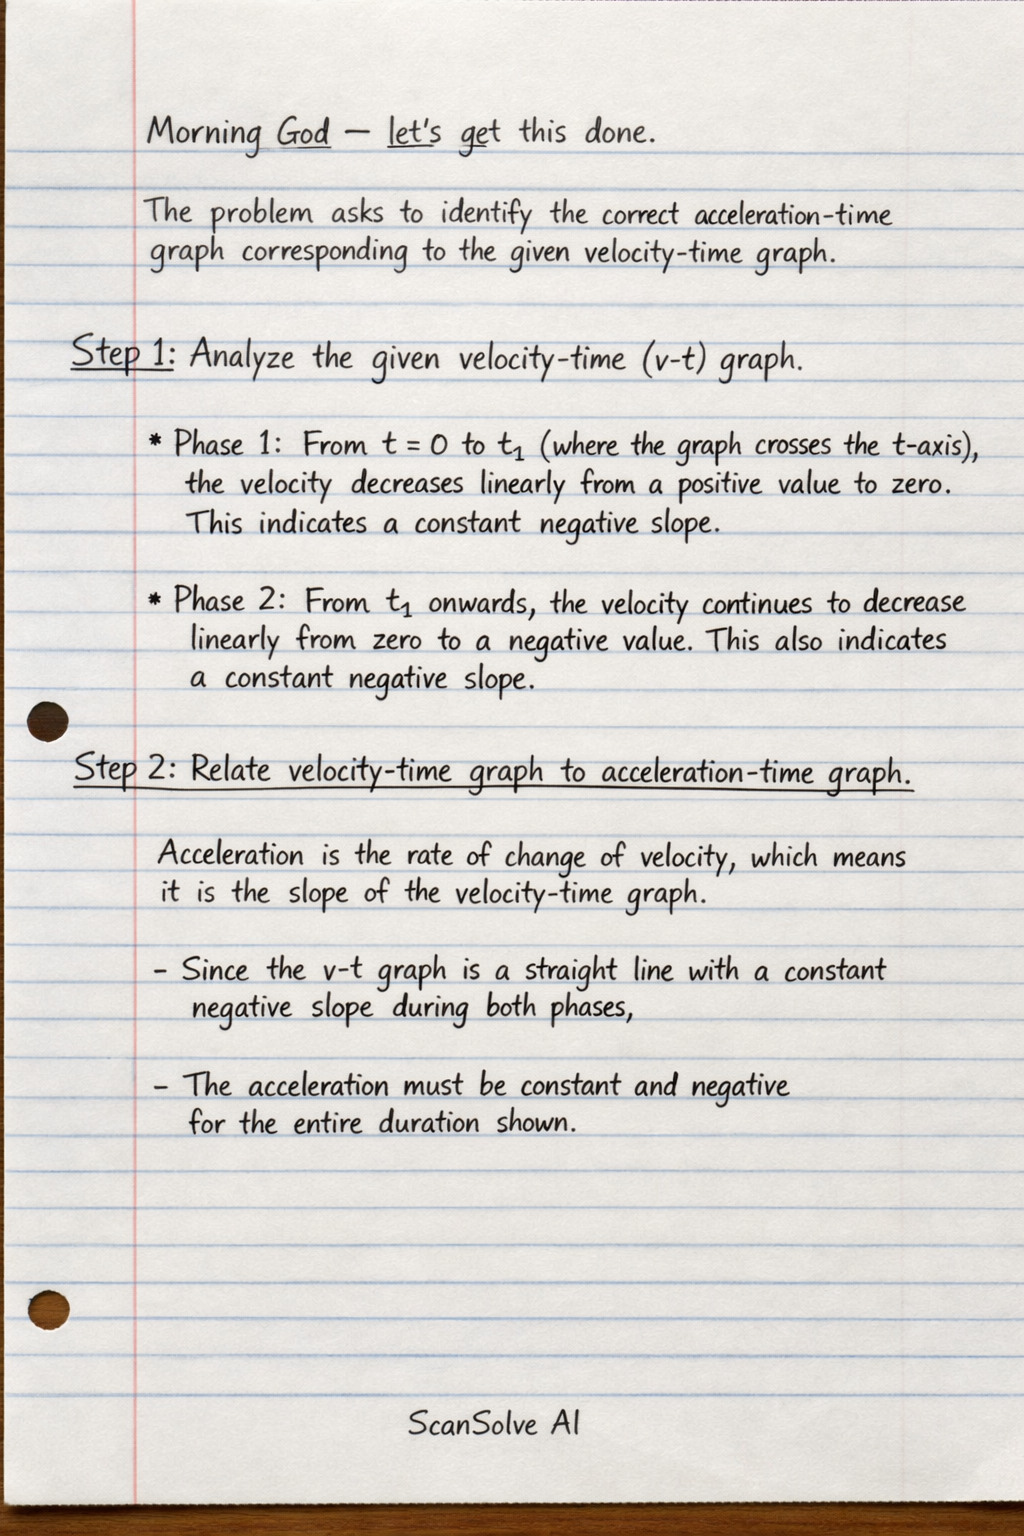
Handwritten Step-by-Step Solution
Get this as a handwritten image on WhatsApp — like a tutor wrote it for you.
Try on WhatsApp