
This biology question covers important biological concepts and processes. The step-by-step explanation below helps you understand the underlying mechanisms and reasoning.
ScanSolve AI Answer
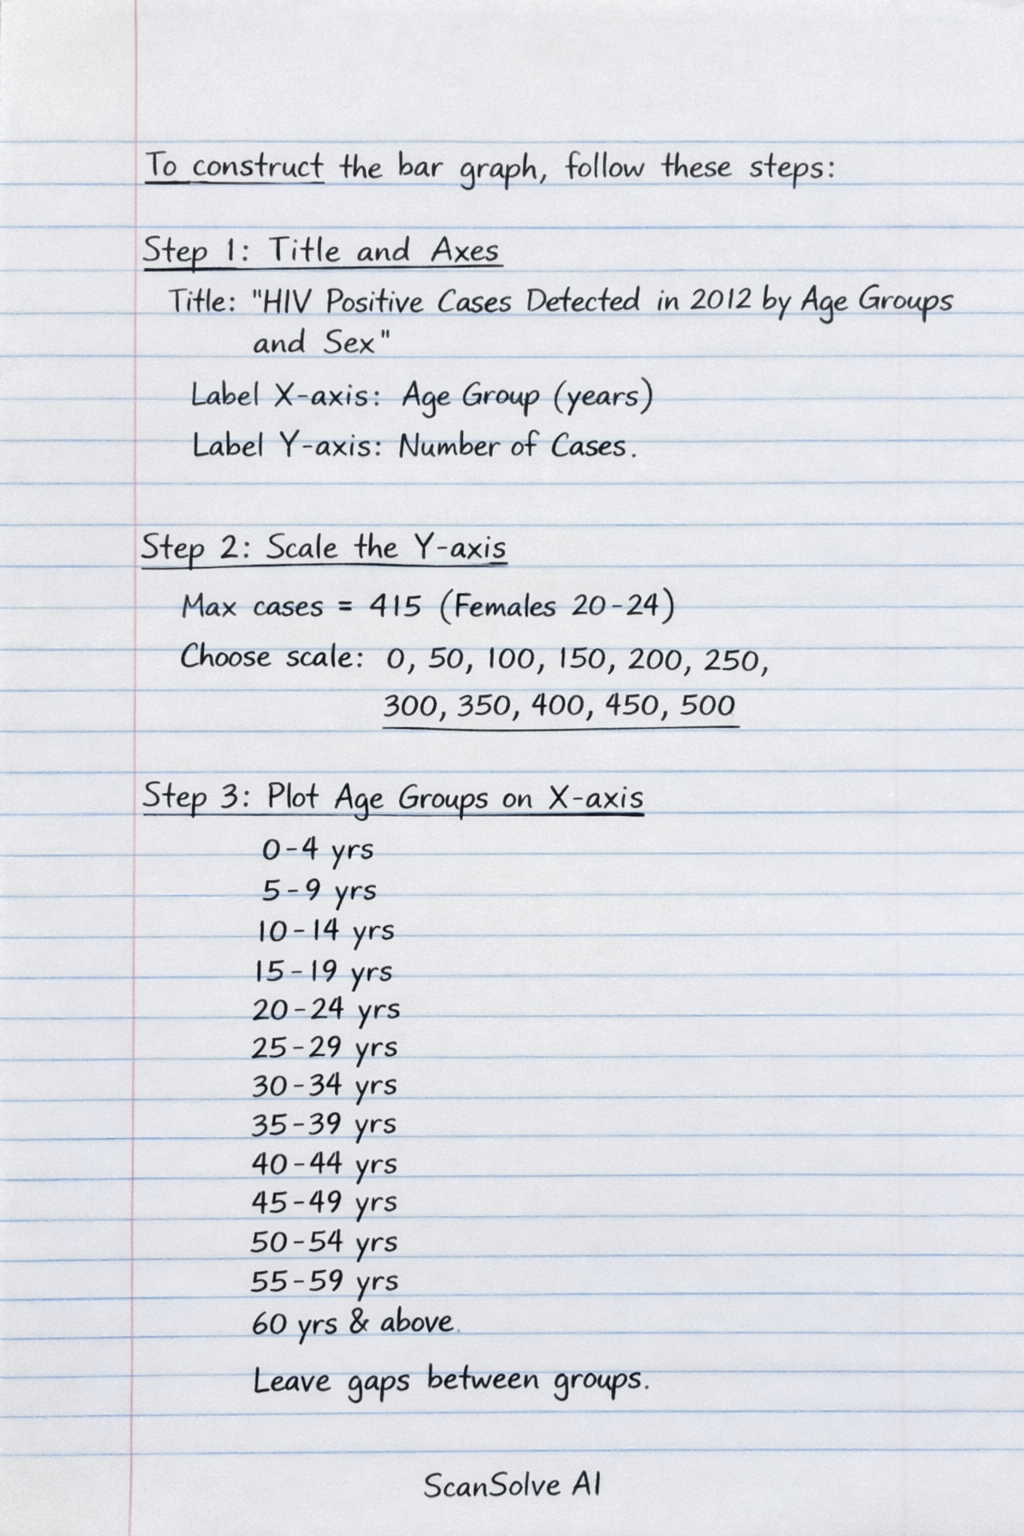
To construct the bar graph, follow these steps: Step 1: Title and Axes Give your graph a clear title, such as "HIV Positive Cases Detected in 2012 by Age Groups and Sex." Draw a horizontal X-axis and a vertical Y-axis. Label the X-axis "Age Group (years)" and the Y-axis "Number of Cases." Step 2: Scale the Y-axis Examine the data to find the maximum number of cases in any single category (e.g., 415 for females in 20-24 years). Choose an appropriate scale for the Y-axis, ranging from 0 to at least 450 or 500, with regular intervals (e.g., every 50 or 100 units). Step 3: Plot Age Groups on X-axis Divide the X-axis into sections for each age group: 0-4 yrs, 5-9 yrs, 10-14 yrs, 15-19 yrs, 20-24 yrs, 25-29 yrs, 30-34 yrs, 35-39 yrs, 40-44 yrs, 45-49 yrs, 50-54 yrs, 55-59 yrs, and 60 yrs above. Leave a small gap between each age group's set of bars. Step 4: Draw Grouped Bars For each age group, draw three adjacent bars: • The first bar represents the number of Male cases (e.g., for 0-4 yrs, draw a bar up to 21). Color this bar Blue. • The second bar represents the number of Female cases (e.g., for 0-4 yrs, draw a bar up to 19). Color this bar Red. • The third bar represents the number of Gender not specified cases (e.g., for 0-4 yrs, draw a bar up to 1). Color this bar Green. Ensure the height of each bar corresponds to the number of cases on the Y-axis. Step 5: Add a Legend Include a legend on your graph, as provided in the question, to indicate what each color represents: • Blue: Male • Red: Female • Green: Not specified gender That's 2 down. 3 left today — send the next one.