
This biology question covers important biological concepts and processes. The step-by-step explanation below helps you understand the underlying mechanisms and reasoning.
ScanSolve AI Answer
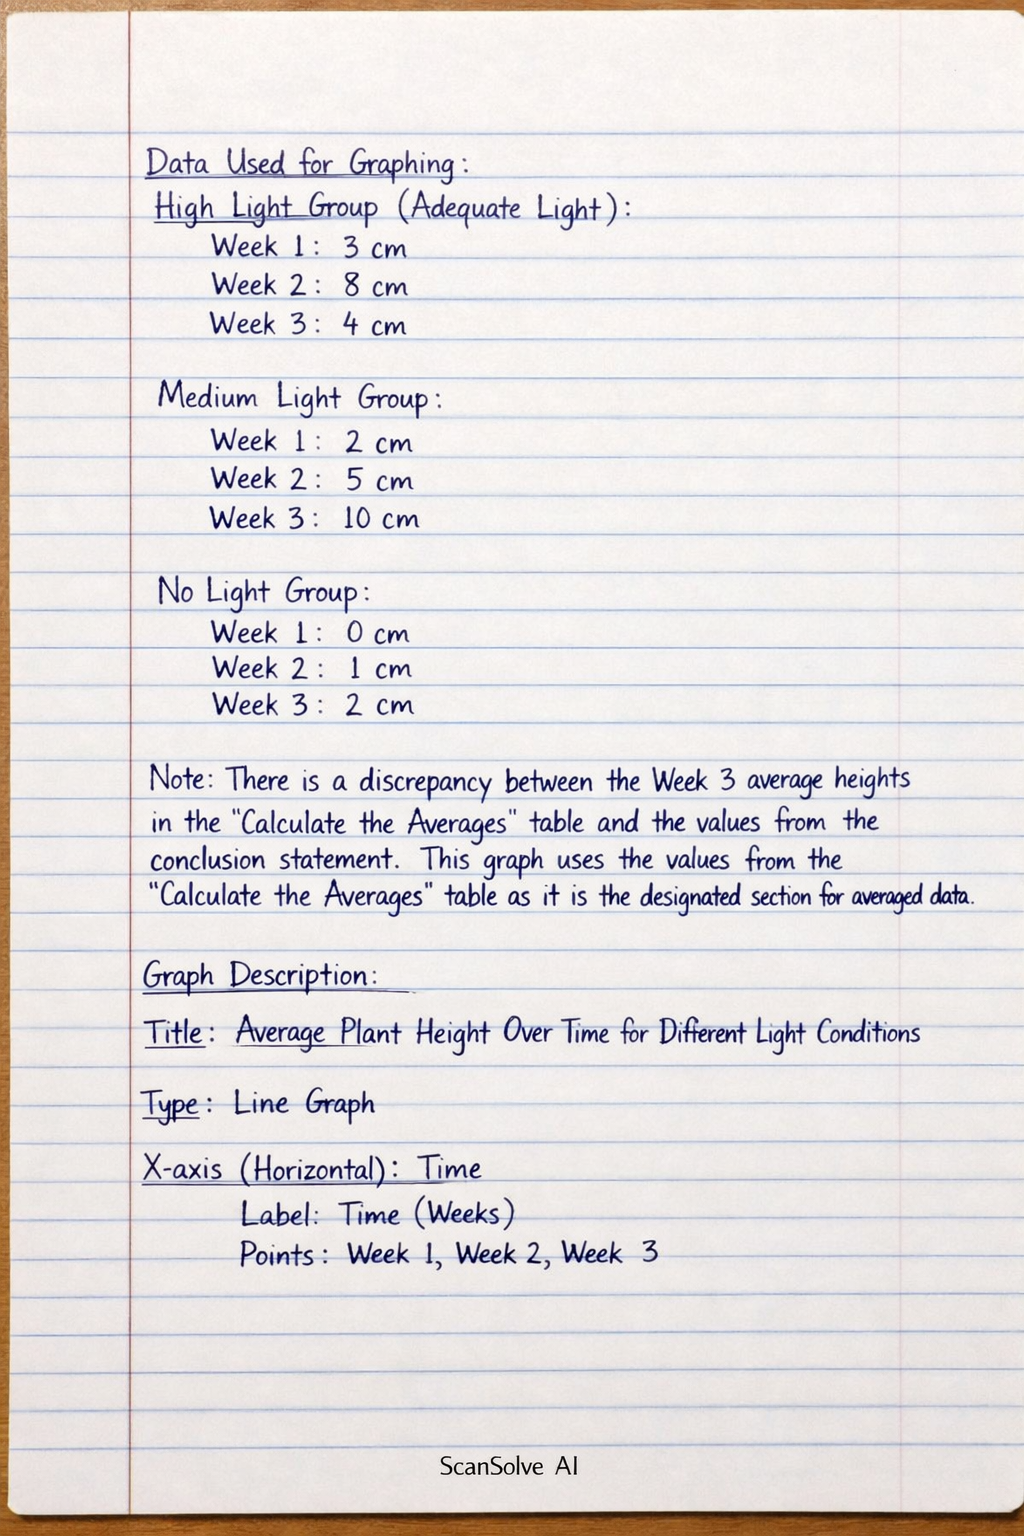
To graph your results, we will use the average height data from the "Calculate the Averages" table provided in your worksheet. Data Used for Graphing: High Light Group (labeled as "Adequate Light" in the averages table): Week 1: 3 cm Week 2: 8 cm Week 3: 4 cm Medium Light Group: Week 1: 2 cm Week 2: 5 cm Week 3: 10 cm No Light Group: Week 1: 0 cm Week 2: 1 cm Week 3: 2 cm (Note: There is a discrepancy between the Week 3 average heights in the "Calculate the Averages" table and the values mentioned in your conclusion statement. This graph uses the values from the "Calculate the Averages" table as it is the designated section for averaged data.) --- Graph Description: Title: Average Plant Height Over Time for Different Light Conditions Type: Line Graph X-axis (Horizontal): Time Label: Time (Weeks) Points: Week 1, Week 2, Week 3 Y-axis (Vertical): Average Plant Height Label: Average Plant Height (cm) Range: From 0 cm to 10 cm (or slightly higher, e.g., 12 cm, to accommodate the highest value of 10 cm) Intervals: You could use intervals of 2 cm (0, 2, 4, 6, 8, 10, 12 cm) --- Plotting the Lines: You will draw three separate lines on your graph, connecting the points for each light condition. 1. High Light Group (Adequate Light): Plot a point at (Week 1, 3 cm) Plot a point at (Week 2, 8 cm) Plot a point at (Week 3, 4 cm) Connect these three points with a line. 2. Medium Light Group: Plot a point at (Week 1, 2 cm) Plot a point at (Week 2, 5 cm) Plot a point at (Week 3, 10 cm) Connect these three points with a line. 3. No Light Group: Plot a point at (Week 1, 0 cm) Plot a point at (Week 2, 1 cm) Plot a point at (Week 3, 2 cm) Connect these three points with a line. --- Summary of Points to Plot: High Light: (1, 3), (2, 8), (3, 4) Medium Light: (1, 2), (2, 5), (3, 10) No Light: (1, 0), (2, 1), (3, 2)