
This biology question covers important biological concepts and processes. The step-by-step explanation below helps you understand the underlying mechanisms and reasoning.
ScanSolve AI Answer
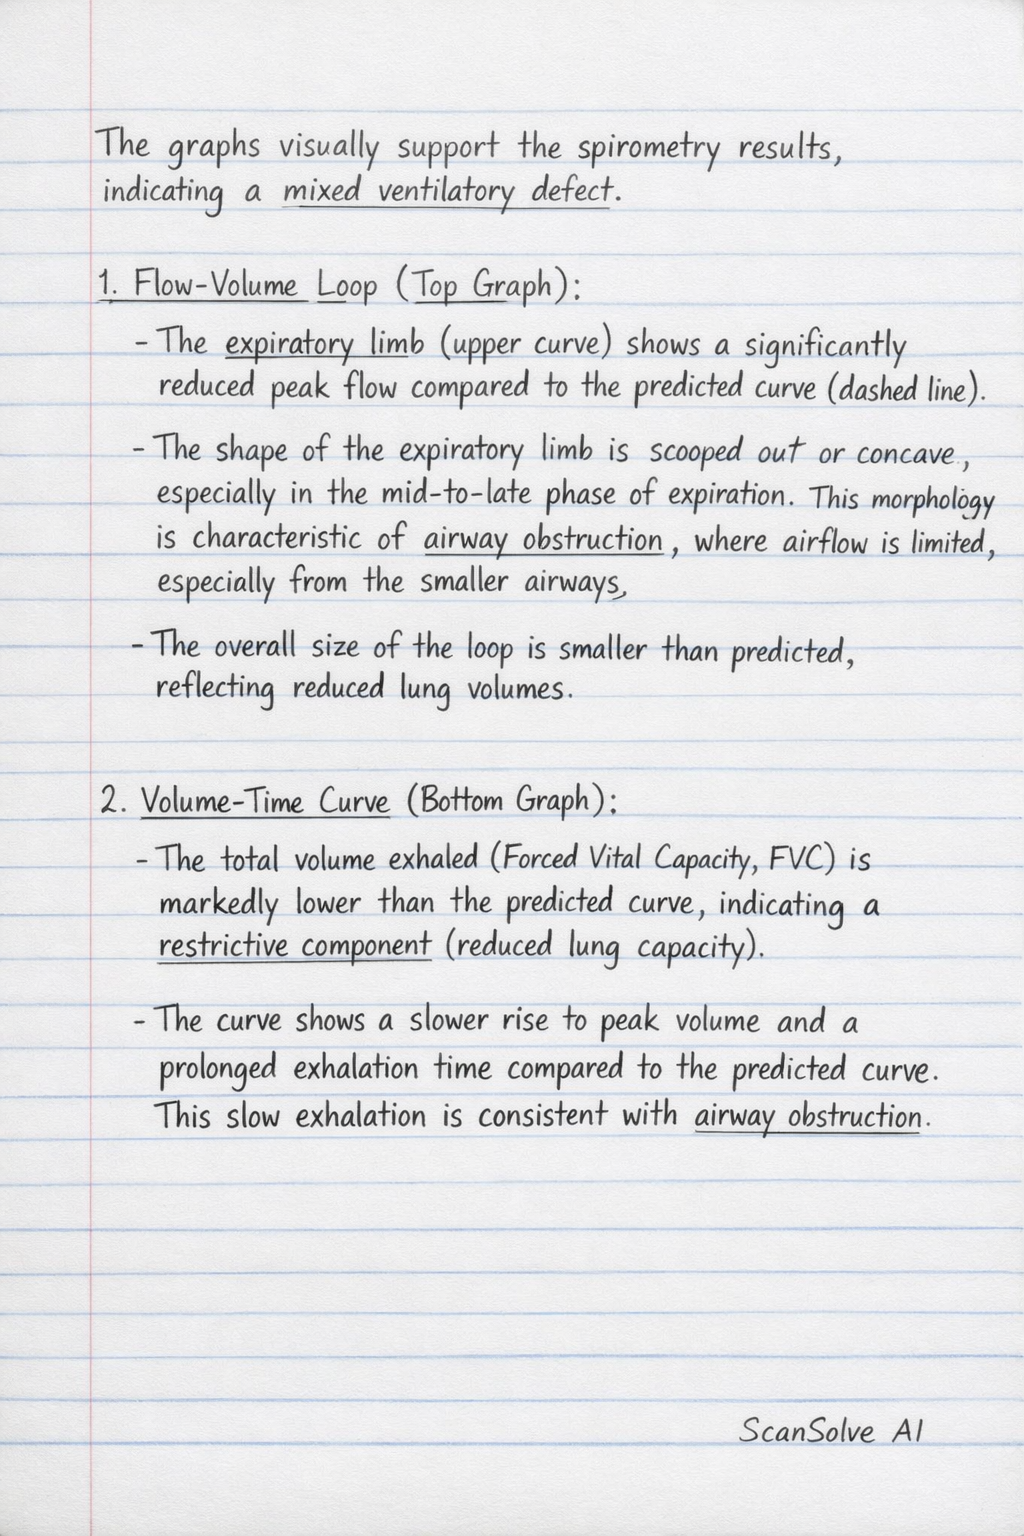
The graphs visually support the spirometry results, indicating a mixed ventilatory defect. 1. Flow-Volume Loop (Top Graph): The expiratory limb* (upper curve) shows a significantly reduced peak flow compared to the predicted curve (dashed line). The shape of the expiratory limb is scooped out or concave, particularly in the mid-to-late phase of expiration. This morphology is characteristic of airway obstruction*, where airflow is limited, especially from the smaller airways. The overall size of the loop is smaller than predicted, reflecting reduced lung volumes. 2. Volume-Time Curve (Bottom Graph): The total volume exhaled (Forced Vital Capacity, FVC) is markedly lower than the predicted curve, indicating a restrictive component* (reduced lung capacity). The curve shows a slower rise to peak volume and a prolonged exhalation time compared to the predicted curve. This slow exhalation is consistent with airway obstruction*. In summary, the reduced overall size of both curves points to the restrictive defect, while the scooped-out expiratory flow-volume loop and prolonged exhalation time on the volume-time curve confirm the obstructive defect. Got more? Send 'em.