
This biology question covers important biological concepts and processes. The step-by-step explanation below helps you understand the underlying mechanisms and reasoning.
ScanSolve AI Answer
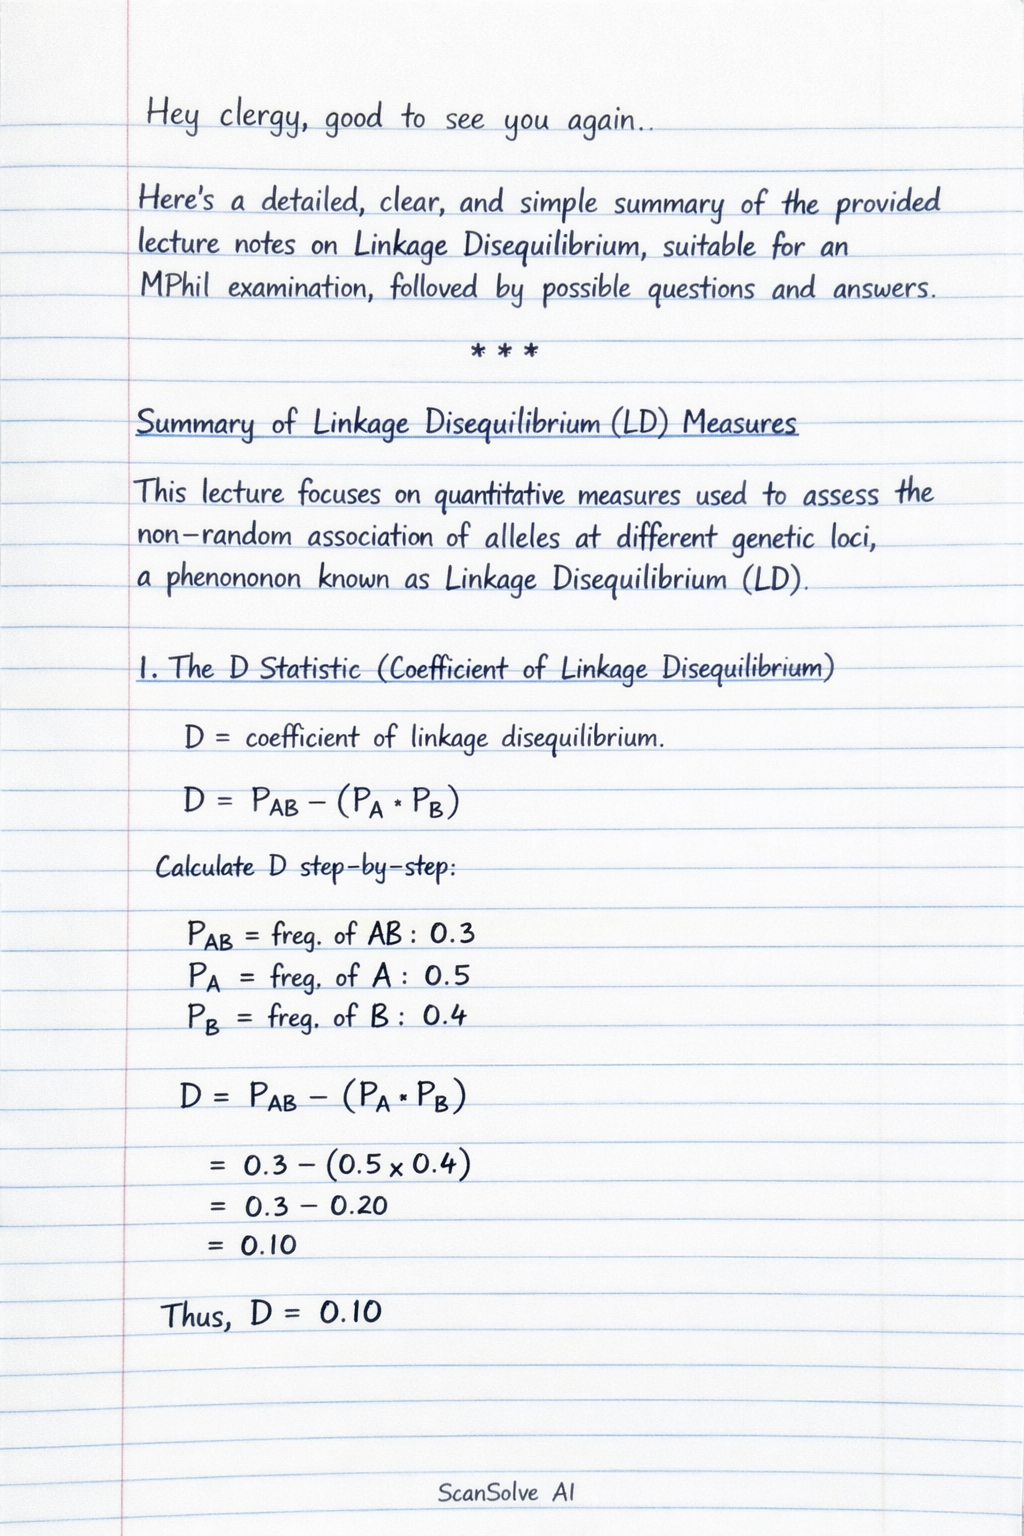
Hey clergy, good to see you again. Here's a detailed, clear, and simple summary of the provided lecture notes on Linkage Disequilibrium, suitable for an MPhil examination, followed by possible questions and answers. Summary of Linkage Disequilibrium (LD) Measures This lecture focuses on quantitative measures used to assess the non-random association of alleles at different genetic loci, a phenomenon known as Linkage Disequilibrium (LD). 1. The D Statistic (Coefficient of Linkage Disequilibrium) Definition: D is a fundamental measure of LD that quantifies the difference between the observed frequency of a haplotype and the frequency expected if the alleles at the two loci were in perfect linkage equilibrium (i.e., assorting independently). Formula: For two loci with alleles A1, A2 and B1, B2, D = P(A1B1) - P(A1)P(B1), where P(A1B1) is the observed frequency of the A1B1 haplotype, and P(A1) and P(B1) are the individual allele frequencies. Range: The value of D can range from -0.25 to +0.25 (this specific range applies when allele frequencies are 0.5 for all alleles; generally, the range depends on allele frequencies). Interpretation: D = 0: Suggests no linkage disequilibrium; alleles are in linkage equilibrium, meaning they assort independently. Negative sign (D < 0): Suggests an excess of recombinant haplotypes (A1B2 or A2B1) compared to expectation. This is often referred to as the repulsion phase*. Positive sign (D > 0): Suggests an excess of coupling haplotypes (A1B1 or A2B2) compared to expectation. This is often referred to as the coupling phase*. Note: D(A1B1) is always equal to D(A2B2), and D(A1B2) is always equal to D(A2B1). Also, D(A1B1) = -D(A1B2). 2. The D' Statistic (Normalized Linkage Disequilibrium) Utility: The raw D value is often affected by allele frequencies, making comparisons across different loci or populations difficult. D' normalizes D by dividing it by its theoretical maximum or minimum possible value, given the observed allele frequencies. Calculation: When D 0: D' = (D)/(D_max) D_max is the smaller of P(A1)P(B2) and P(A2)P(B1). When D < 0: D' = (D)/(D_min) D_min is the larger of -P(A1)P(B1) and -P(A2)P(B2). Range: D' ranges from -1 to +1. Interpretation: A D' value of 1 or -1 indicates complete LD, meaning only two of the four possible haplotypes exist. A commonly used cutoff for significant LD is D' > 0.5. 3. The r^2 Statistic (Squared Correlation Coefficient) Utility: r^2 is another widely used measure of LD, representing the squared correlation coefficient between alleles at two loci. It is often preferred because it directly relates to the power of association studies. Formula: r^2 = (D^2)/(P(A1)P(A2)P(B1)P(B2)) where P(A1), P(A2), P(B1), P(B2) are the individual allele frequencies. Range: r^2 ranges from 0 to 1. Interpretation: r^2 = 0: Loci are in complete linkage equilibrium (no association). r^2 = 1: Loci are in complete linkage disequilibrium (perfect association, meaning one allele at locus A perfectly predicts the allele at locus B). Increasing r^2 values denote stronger linkage disequilibrium. Possible Questions and Answers for MPhil Examination Question 1: Explain the D statistic for Linkage Disequilibrium, including its range and how its sign (positive or negative) is interpreted in terms of haplotype phases. Answer: The D statistic (coefficient of linkage disequilibrium) quantifies the non-random association between alleles at two different loci. It is calculated as the observed frequency of a specific haplotype minus the frequency expected if the alleles were in linkage equilibrium (i.e., assorting independently). For alleles A1, A2 at locus A and B1, B2 at locus B, D = P(A1B1) - P(A1)P(B1). The value of D can range from -0.25 to +0.25 (though its exact maximum and minimum depend on allele frequencies). If D = 0, the loci are in linkage equilibrium*, meaning alleles at the two loci are randomly associated. If D > 0 (positive sign), there is an excess of coupling haplotypes* (A1B1 and A2B2) compared to what is expected by chance. This indicates that these specific combinations of alleles are found together more frequently. If D < 0 (negative sign), there is an excess of recombinant haplotypes* (A1B2 and A2B1) compared to expectation. This indicates that these combinations are found together more frequently. Question 2: Describe the normalized LD measure D' and its utility. What is the commonly accepted cutoff for significant LD using D'? Answer: The D' statistic is a normalized measure of linkage disequilibrium, designed to overcome the limitation that the raw D value is heavily influenced by allele frequencies, making it difficult to compare across different genetic regions or populations. D' normalizes D by dividing it by its theoretical maximum (D_max) or minimum (D_min) possible value, given the observed allele frequencies. If D 0, D' = (D)/(D_max), where D_max = (P(A1)P(B2), P(A2)P(B1)). If D < 0, D' = (D)/(D_min), where D_min = (-P(A1)P(B1), -P(A2)P(B2)). D' ranges from -1 to +1. A value of 1 or -1 indicates complete LD, meaning that only two of the four possible haplotypes exist in the population. This measure is particularly useful for identifying historical recombination events. A commonly accepted cutoff for considering a pair of alleles to be in significant linkage disequilibrium is when D' is greater than 0.5. Question 3: Explain the r^2 statistic as an alternative measure of Linkage Disequilibrium. How are its values interpreted in terms of linkage equilibrium and disequilibrium? Answer: The r^2 statistic is another widely used measure of linkage disequilibrium, representing the squared correlation coefficient between alleles at two loci. It is calculated using the formula: r^2 = (D^2)/(P(A1)P(A2)P(B1)P(B2)) where D is the coefficient of linkage disequilibrium, and P(A1), P(A2), P(B1), P(B2) are the individual allele frequencies at loci A and B, respectively. The value of r^2 ranges from 0 to 1, and its interpretation is straightforward: If r^2 = 0, the loci are in complete linkage equilibrium*, meaning there is no statistical association between the alleles at the two loci. If r^2 = 1, the loci are in complete linkage disequilibrium*, indicating a perfect correlation between the alleles. This means that knowing the allele at one locus perfectly predicts the allele at the other locus. Increasing values of r^2 between 0 and 1 denote progressively stronger linkage disequilibrium*. r^2 is particularly useful in association studies because it directly reflects the statistical power to detect an association between a marker and a disease-causing variant. Question 4: Using the example data provided in the notes: Observed haplotype data: A1B1: 0.6 A1B2: 0.1 A2B1: 0.2 A2B2: 0.1 Calculated allele data: A1 (p_1): 0.7 A2 (p_2): 0.3 B1 (q_1): 0.8 B2 (q_2): 0.2 Calculate the D statistic and the r^2 statistic for these two loci. Step 1: Calculate the D statistic. The formula for D is D = P(A1B1) - P(A1)P(B1). From the observed data, P(A1B1) = 0.6. From the calculated allele data, P(A1) = 0.7 and P(B1) = 0.8. Substitute these values into the formula: D = 0.6 - (0.7 × 0.8) D = 0.6 - 0.56 D = 0.04 Step 2: Calculate the r^2 statistic. The formula for r^2 is r^2 = (D^2)/(P(A1)P(A2)P(B1)P(B2)). We have D = 0.04. From the calculated allele data: P(A1) = 0.7 P(A2) = 0.3 P(B1) = 0.8 P(B2) = 0.2 Substitute these values into the formula: r^2 = ((0.04)^2)/((0.7)(0.3)(0.8)(0.2)) r^2 = (0.0016)/(0.0336) r^2 ≈ 0.0476 The final answer is D = 0.04, r^2 ≈ 0.0476.