
This biology question covers important biological concepts and processes. The step-by-step explanation below helps you understand the underlying mechanisms and reasoning.
ScanSolve AI Answer
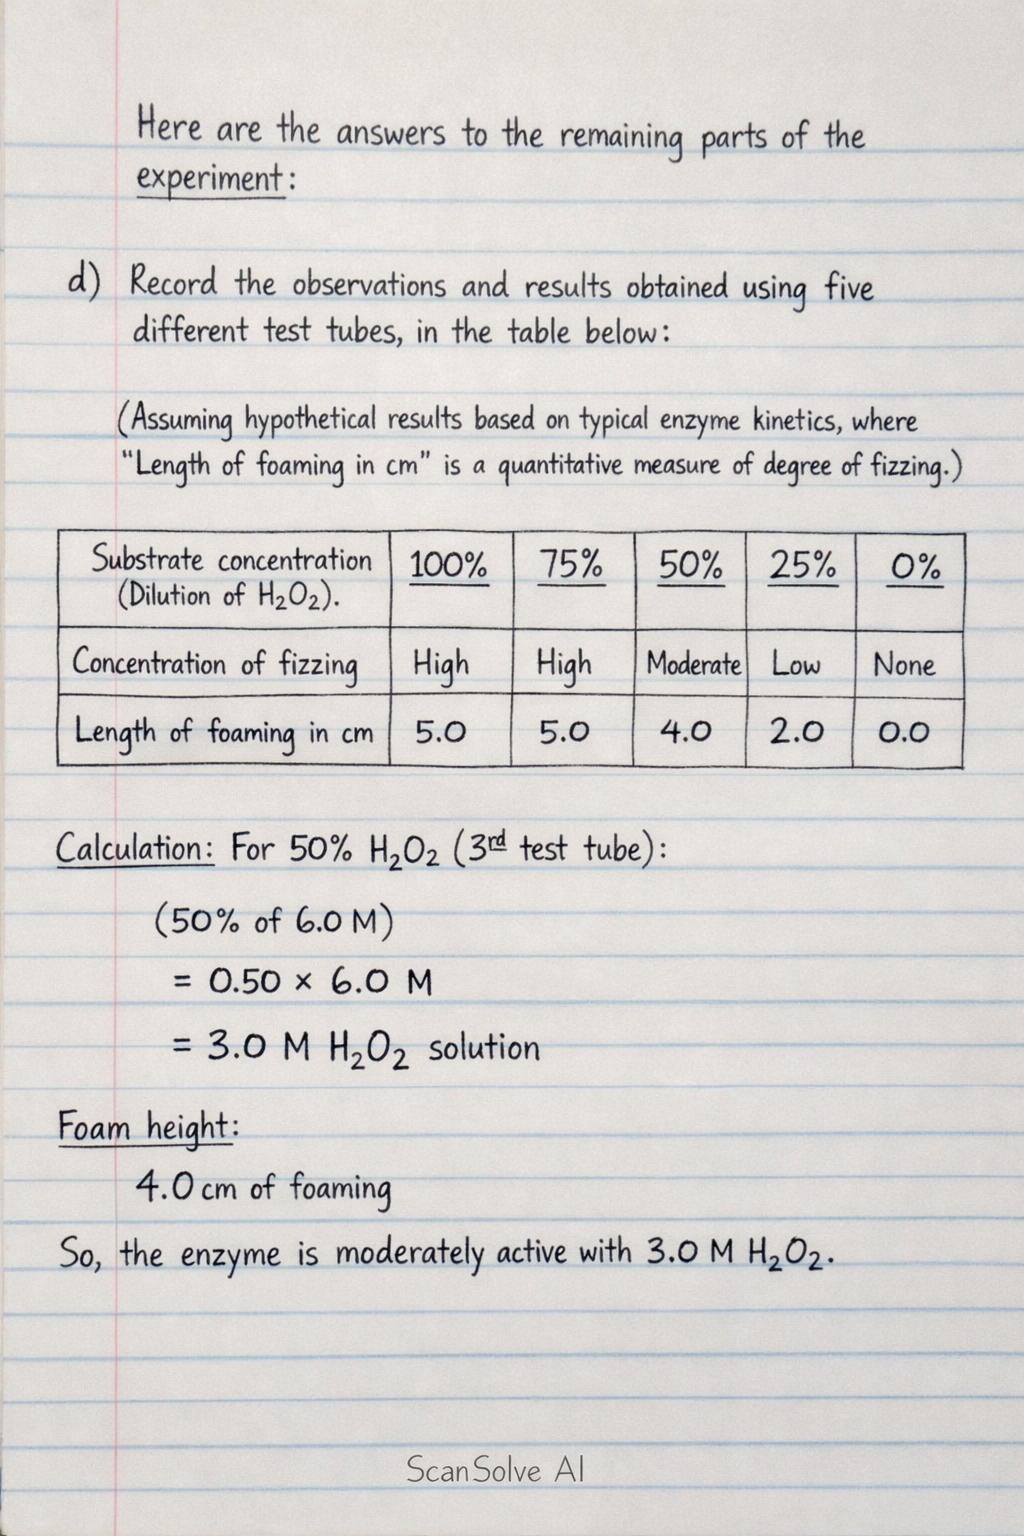
Here are the answers to the remaining parts of the experiment: d) Record the observations and results obtained using five different test tubes, in the table below (Assuming hypothetical results based on typical enzyme kinetics, where "Length of foaming in cm" is a quantitative measure of the degree of fizzing.) | Substrate concentration Percentage Dilution of H_2O_2 | 100% | 75% | 50% | 25% | 0% | | :------------------------------------------------------------ | :--- | :-- | :-- | :-- | :-- | | Concentration of fizzing | High | High | Moderate | Low | None | | Length of foaming in cm | 5.0 | 5.0 | 4.0 | 2.0 | 0.0 | e) Interpret the results obtained in d) above as fully as you can. The results show that as the concentration of hydrogen peroxide (substrate) increases from 0% to 75%, the length of foaming (indicating the rate of catalase activity) also increases. This is because more substrate molecules are available to bind with the active sites of the catalase enzyme, leading to a faster reaction rate. However, at 75% and 100% hydrogen peroxide concentration, the length of foaming remains constant at 5.0 cm. This suggests that the enzyme has reached its saturation point, where all available active sites on the catalase enzyme molecules are continuously occupied by substrate molecules. At this point, increasing the substrate concentration further does not increase the reaction rate because the enzyme is working at its maximum capacity (Vmax). The 0% hydrogen peroxide solution shows no foaming, as there is no substrate for the enzyme to act upon. f) Does the result confirm or refute the hypothesis? The results confirm the hypothesis. The hypothesis stated that as the substrate concentration increases, the rate of catalase enzyme activity will increase until a saturation point is reached, after which the rate will plateau. The observed data clearly demonstrates this trend, with increasing foaming up to 75% H_2O_2 and then a plateau at 75% and 100% H_2O_2. g) Plot a bar graph using these results on the graph paper To plot a bar graph: 1. X-axis: Label the horizontal axis "Substrate Concentration (Percentage Dilution of H_2O_2)" and mark points for 0%, 25%, 50%, 75%, and 100%. 2. Y-axis: Label the vertical axis "Length of Foaming (cm)" and scale it appropriately from 0 cm to at least 5.0 cm. 3. Bars: Draw a bar for each substrate concentration, with the height of the bar corresponding to the "Length of foaming in cm" value from the table in part (d). For 0% H_2O_2, the bar height is 0.0 cm. For 25% H_2O_2, the bar height is 2.0 cm. For 50% H_2O_2, the bar height is 4.0 cm. For 75% H_2O_2, the bar height is 5.0 cm. For 100% H_2O_2, the bar height is 5.0 cm. 4. Title: Give the graph a clear title, such as "Effect of Substrate Concentration on Catalase Activity."