
This biology question covers important biological concepts and processes. The step-by-step explanation below helps you understand the underlying mechanisms and reasoning.
ScanSolve AI Answer
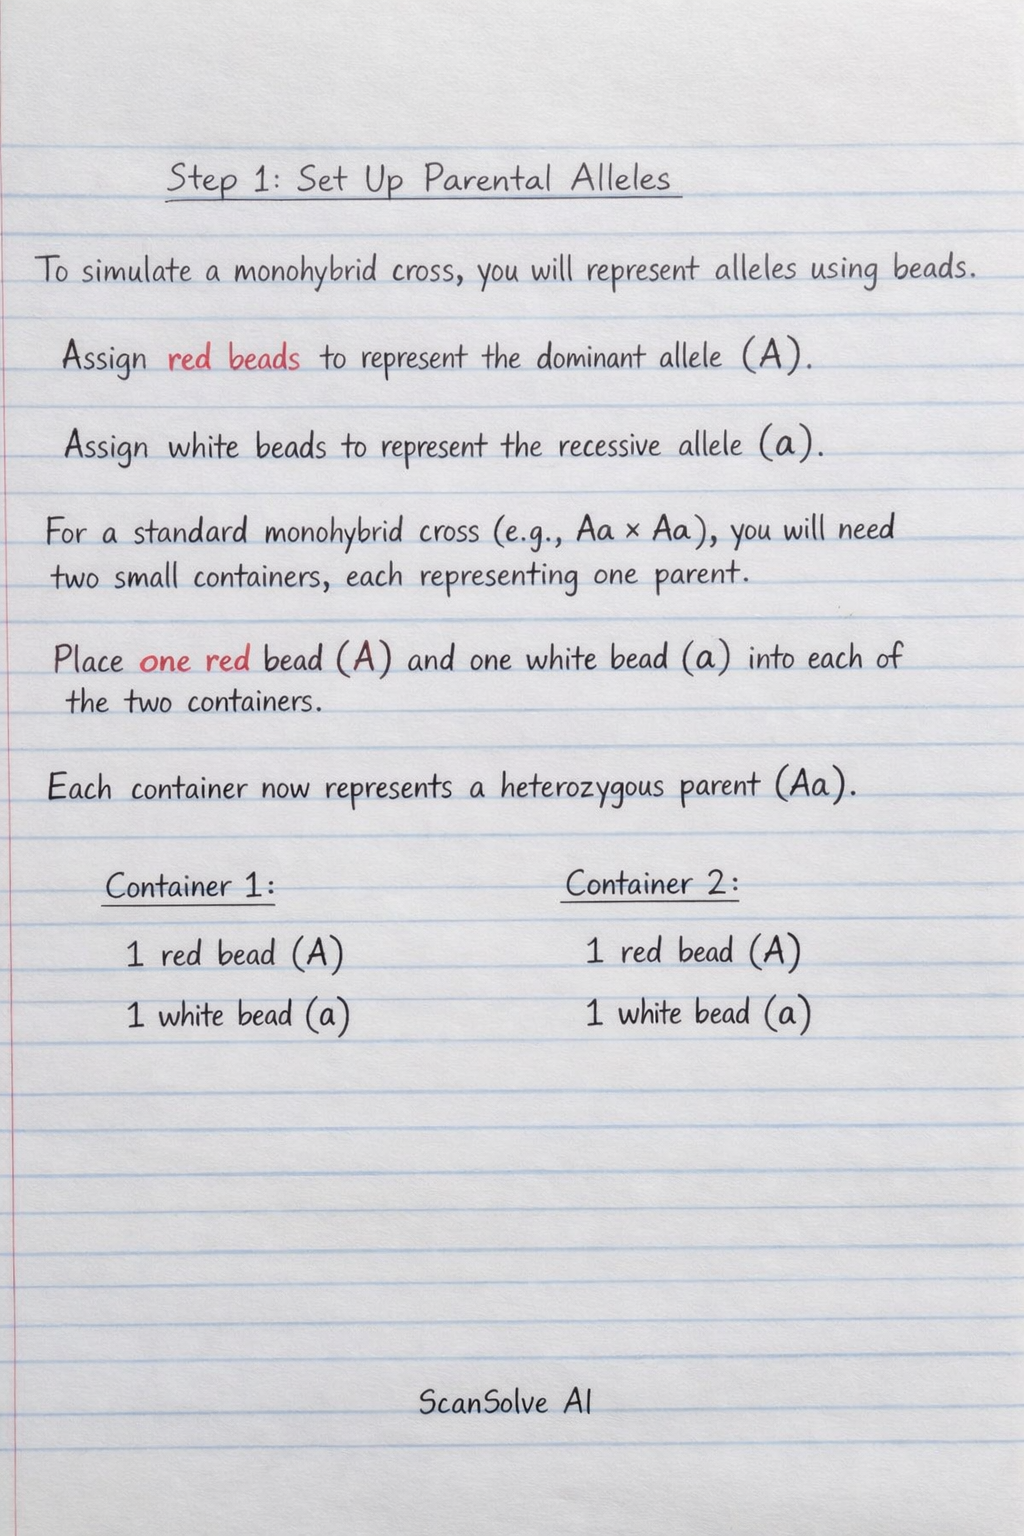
This practical guides you through simulating a monohybrid cross to understand Mendelian inheritance. Here's how to perform and analyze the experiment: Step 1: Set Up Parental Alleles To simulate a monohybrid cross, you will represent alleles using beads. • Assign red beads to represent the dominant allele (A). • Assign white beads to represent the recessive allele (a). • For a standard monohybrid cross (e.g., Aa × Aa), you will need two small containers, each representing one parent. • Place one red bead (A) and one white bead (a) into each of the two containers. Each container now represents a heterozygous parent (Aa). Step 2: Simulate a Monohybrid Cross This step simulates the random combination of alleles during fertilization. • Without looking, randomly select one bead from the first parental container. • Similarly, randomly select one bead from the second parental container. • Pair these two selected beads together. This pair represents the genotype of one offspring. • Record this genotype (e.g., AA, Aa, or aa) on your observation sheet. • Return the beads to their respective containers. • Repeat this process many times (e.g., 50-100 times) to generate a sufficient number of offspring genotypes for accurate analysis. Step 3: Record Results As you simulate each cross, record the following: • Note the offspring genotype for each pair of beads (e.g., AA, Aa, or aa). Keep a tally for each genotype. • Identify the corresponding phenotype: • If the genotype is AA or Aa, the phenotype is the dominant trait (since red is dominant). • If the genotype is aa, the phenotype is the recessive trait (since white is recessive). • Keep a separate tally for the number of dominant phenotypes and recessive phenotypes. Step 4: Analyze Results After completing all your simulated crosses, calculate and compare the ratios: • Calculate the observed genotypic ratio. For example, if you had 25 AA, 50 Aa, and 25 aa offspring, the ratio would be 25:50:25, which simplifies to 1:2:1. • Calculate the observed phenotypic ratio. Using the example above, 25 AA + 50 Aa = 75 dominant phenotypes, and 25 aa = 25 recessive phenotypes. The ratio would be 75:25, which simplifies to 3:1. • Compare your observed ratios with Mendelian predictions for a monohybrid cross (Aa × Aa): • Predicted genotypic ratio: 1 AA : 2 Aa : 1 aa • Predicted phenotypic ratio: 3 dominant : 1 recessive • Discuss any differences between your observed ratios and the predicted Mendelian ratios. These differences are typically due to random chance, especially if the number of trials is small. Last free one today — make it count tomorrow, or type /upgrade for unlimited.