The table below shows the results of an investigation showing the smoking habits of men aged 40 – 79 and the number that die from lung cancer.

Biology
The table below shows the results of an investigation showing the smoking habits of men aged 40 – 79 and the number that die from lung cancer.

ScanSolve AI Answer

Answer

11 times

Question 3

3.1.1

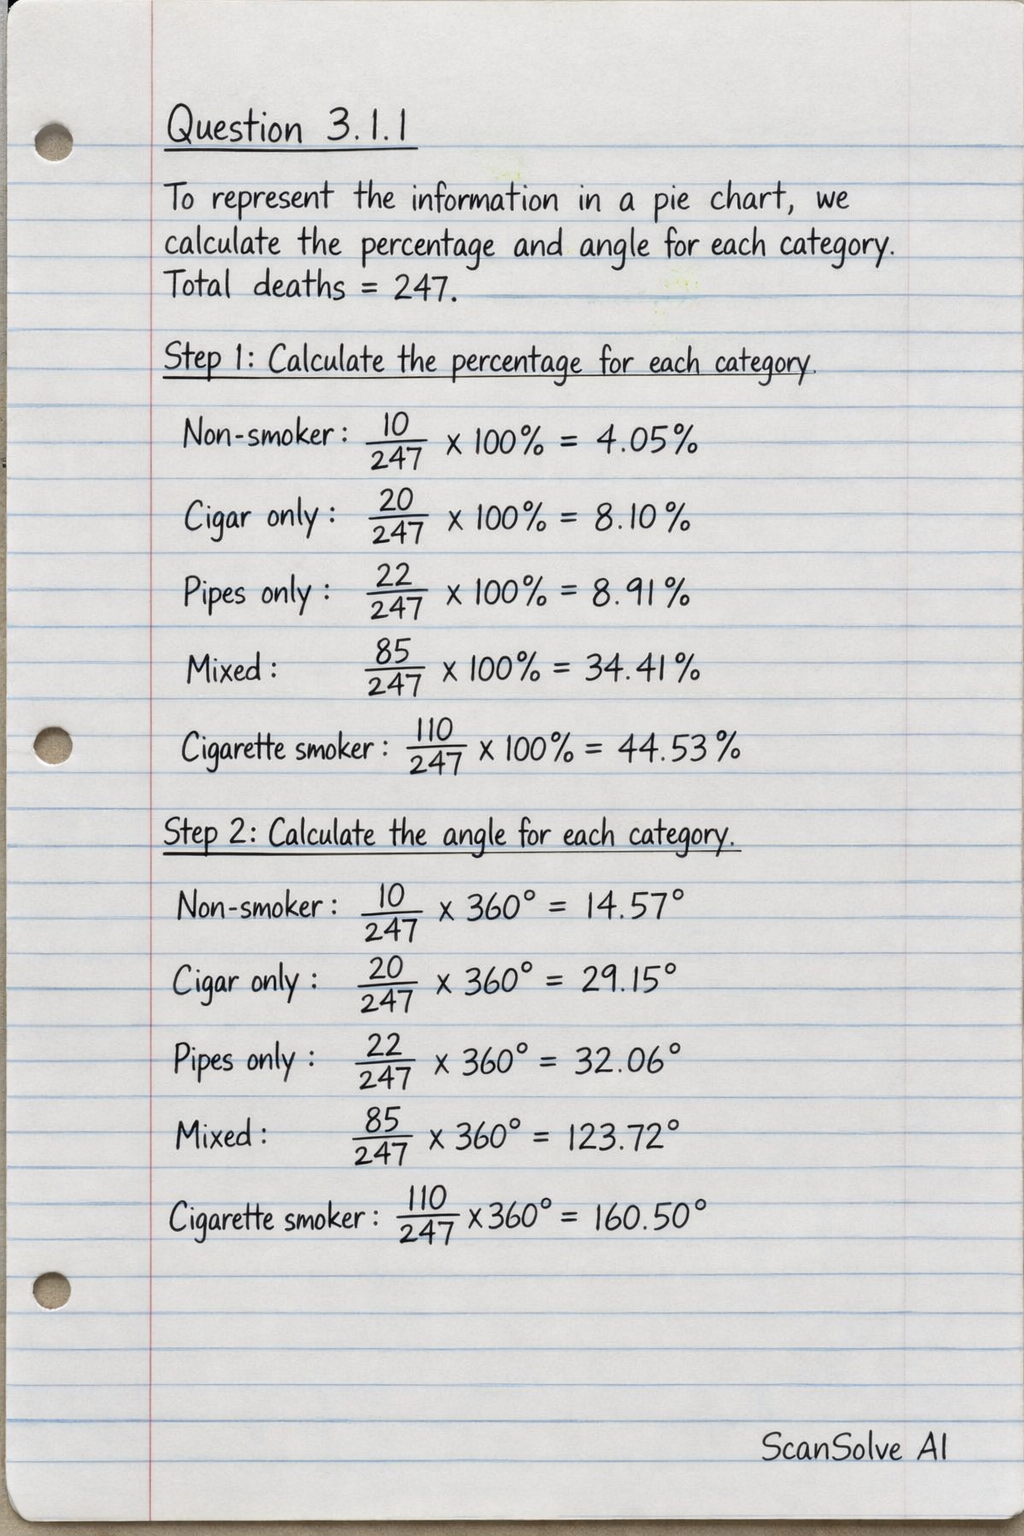
To represent the information in a pie chart, we calculate the percentage and angle for each category. The total number of deaths is 247.

Step 1: Calculate the percentage for each category.

  • Non-smoker: 10247×100%4.05%\frac{10}{247} \times 100\% \approx 4.05\%
  • Cigar only: 20247×100%8.10%\frac{20}{247} \times 100\% \approx 8.10\%
  • Pipes only: 22247×100%8.91%\frac{22}{247} \times 100\% \approx 8.91\%
  • Mixed: 85247×100%34.41%\frac{85}{247} \times 100\% \approx 34.41\%
  • Cigarette smoker: 110247×100%44.53%\frac{110}{247} \times 100\% \approx 44.53\%

Step 2: Calculate the angle for each category.

  • Non-smoker: 10247×36014.57\frac{10}{247} \times 360^\circ \approx 14.57^\circ
  • Cigar only: 20247×36029.15\frac{20}{247} \times 360^\circ \approx 29.15^\circ
  • Pipes only: 22247×36032.06\frac{22}{247} \times 360^\circ \approx 32.06^\circ
  • Mixed: 85247×360123.72\frac{85}{247} \times 360^\circ \approx 123.72^\circ
  • Cigarette smoker: 110247×360160.50\frac{110}{247} \times 360^\circ \approx 160.50^\circ

The calculations for the pie chart are:

  • Non-smoker: 4.05%4.05\% (14.5714.57^\circ)
  • Cigar only: 8.10%8.10\% (29.1529.15^\circ)
  • Pipes only: 8.91%8.91\% (32.0632.06^\circ)
  • Mixed: 34.41%34.41\% (123.72123.72^\circ)
  • Cigarette smoker: 44.53%44.53\% (160.50160.50^\circ)

3.1.2

Two ways to increase the reliability of the investigation are: • Increase the sample size (study more men). • Repeat the investigation multiple times and compare the results.

3.1.3

Two factors kept constant in the investigation are: • The age range of the men (40-79 years). • The gender of the participants (men).

3.1.4

The habit with the least influence in causing death from lung cancer is Non-smoker, with 10 deaths per 100 000.

3.1.5

Step 1: Identify the number of deaths for cigarette smokers and non-smokers.

  • Deaths for cigarette smokers = 110
  • Deaths for non-smokers = 10

Step 2: Calculate how many times more likely a cigarette smoker is to die. DeathsforcigarettesmokerDeathsfornonsmoker=11010=11\frac{Deaths for cigarette smoker}{Deaths for non-smoker} = \frac{110}{10} = 11 A cigarette-smoker is 11times\boxed{11 times} more likely to die of lung cancer than a non-smoker.

3.1.6

Cilia are tiny hair-like structures that sweep mucus and trapped particles out of the breathing tract. When smoking destroys cilia, mucus and harmful substances accumulate in the airways, leading to increased risk of infections, chronic cough, and respiratory diseases.

Send me the next one 📸

Was this helpful?

Need help with your own homework?

Get instant step-by-step solutions to any question. Free to start.

Ask Your Question
Handwritten step-by-step solution preview

Handwritten Step-by-Step Solution

Get this as a handwritten image on WhatsApp — like a tutor wrote it for you.

Try on WhatsApp

Still have questions?

Quick Answer

Question 3 3.1.1 To represent the information in a pie chart, we calculate the percentage and angle for each category.

The table below shows the results of an investigation showing the smoking habits of men aged 40 – 79 and the number that die from lung cancer.
Biology

This biology question covers important biological concepts and processes. The step-by-step explanation below helps you understand the underlying mechanisms and reasoning.

ScanSolve AI Answer
Question 3 3.1.1 To represent the information in a pie chart, we calculate the percentage and angle for each category. The total number of deaths is 247. Step 1: Calculate the percentage for each category. Non-smoker: (10)/(247) × 100\% ≈ 4.05\% Cigar only: (20)/(247) × 100\% ≈ 8.10\% Pipes only: (22)/(247) × 100\% ≈ 8.91\% Mixed: (85)/(247) × 100\% ≈ 34.41\% Cigarette smoker: (110)/(247) × 100\% ≈ 44.53\% Step 2: Calculate the angle for each category. Non-smoker: (10)/(247) × 360^ ≈ 14.57^ Cigar only: (20)/(247) × 360^ ≈ 29.15^ Pipes only: (22)/(247) × 360^ ≈ 32.06^ Mixed: (85)/(247) × 360^ ≈ 123.72^ Cigarette smoker: (110)/(247) × 360^ ≈ 160.50^ The calculations for the pie chart are: Non-smoker: 4.05\% (14.57^) Cigar only: 8.10\% (29.15^) Pipes only: 8.91\% (32.06^) Mixed: 34.41\% (123.72^) Cigarette smoker: 44.53\% (160.50^) 3.1.2 Two ways to increase the reliability of the investigation are: • Increase the sample size (study more men). • Repeat the investigation multiple times and compare the results. 3.1.3 Two factors kept constant in the investigation are: • The age range of the men (40-79 years). • The gender of the participants (men). 3.1.4 The habit with the least influence in causing death from lung cancer is Non-smoker, with 10 deaths per 100 000. 3.1.5 Step 1: Identify the number of deaths for cigarette smokers and non-smokers. Deaths for cigarette smokers = 110 Deaths for non-smokers = 10 Step 2: Calculate how many times more likely a cigarette smoker is to die. Deaths for cigarette smokerDeaths for non-smoker = (110)/(10) = 11 A cigarette-smoker is 11 times more likely to die of lung cancer than a non-smoker. 3.1.6 Cilia are tiny hair-like structures that sweep mucus and trapped particles out of the breathing tract. When smoking destroys cilia, mucus and harmful substances accumulate in the airways, leading to increased risk of infections, chronic cough, and respiratory diseases. Send me the next one 📸