
We read your photo as:
Draw a histogram to represent the results in women aged 40 to 79.
Mathematics
ScanSolve AI Answer
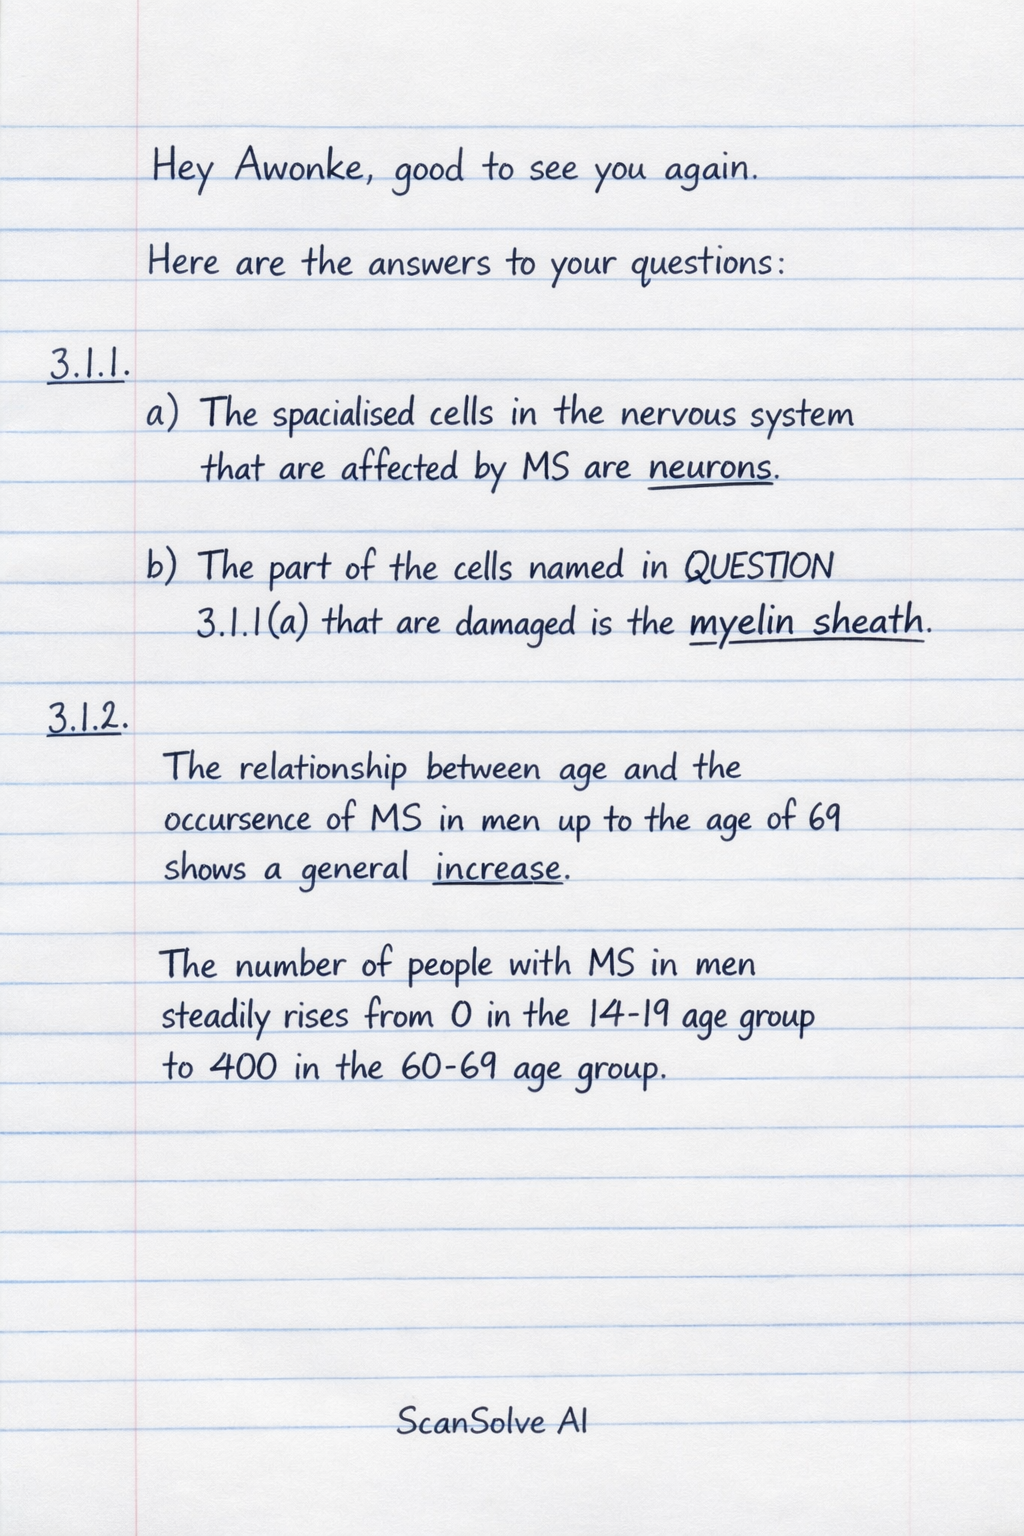
Here are the answers to your questions:
3.1.1
a) The specialised cells in the nervous system that are affected by MS are neurons.
b) The part of the cells named in QUESTION 3.1.1(a) that are damaged is the myelin sheath.
3.1.2
The relationship between age and the occurrence of MS in men up to the age of 69 shows a general increase. The number of people with MS in men steadily rises from 0 in the 14-19 age group to 400 in the 60-69 age group.
3.1.3
To draw a histogram representing the results in women aged 40 to 79, follow these steps:
- Title: Give the histogram a clear title, e.g., "Occurrence of Multiple Sclerosis in Women Aged 40-79".
- X-axis (Horizontal): Label this axis "Age Group (Years)". Mark the intervals for the age groups: 40-49, 50-59, 60-69, and 70-79.
- Y-axis (Vertical): Label this axis "Number of People with MS (per 100 000 people)". Choose an appropriate scale that goes up to at least 620 (the highest value), for example, increments of 100.
- Draw Bars: For each age group, draw a bar whose height corresponds to the number of people with MS:
- 40-49: 450
- 50-59: 620
- 60-69: 600
- 70-79: 240 The bars should be adjacent to each other, as a histogram represents continuous data.
Was this helpful?
Still stuck on this one?
Ask a follow-up, and the answer starts from this question.
Got a different question?Ask your own question
More Mathematics Questions
QDraw a histogram of the data.QDraw a histogram and frequency polygon based on the provided data.QUse the histogram to complete the table belowQHow do I draw a population pyramid using bar graphs, given age and sex distribution data?QCreate a bar graph showing the number of HIV positive cases detected in 2012, broken down by age…
Browse by topic:Statistics
Handwritten Step-by-Step Solution
Get this as a handwritten image on WhatsApp — like a tutor wrote it for you.
Try on WhatsApp