
This business/management problem is solved step by step below, with detailed explanations to help you understand the method and arrive at the correct answer.
ScanSolve AI Answer
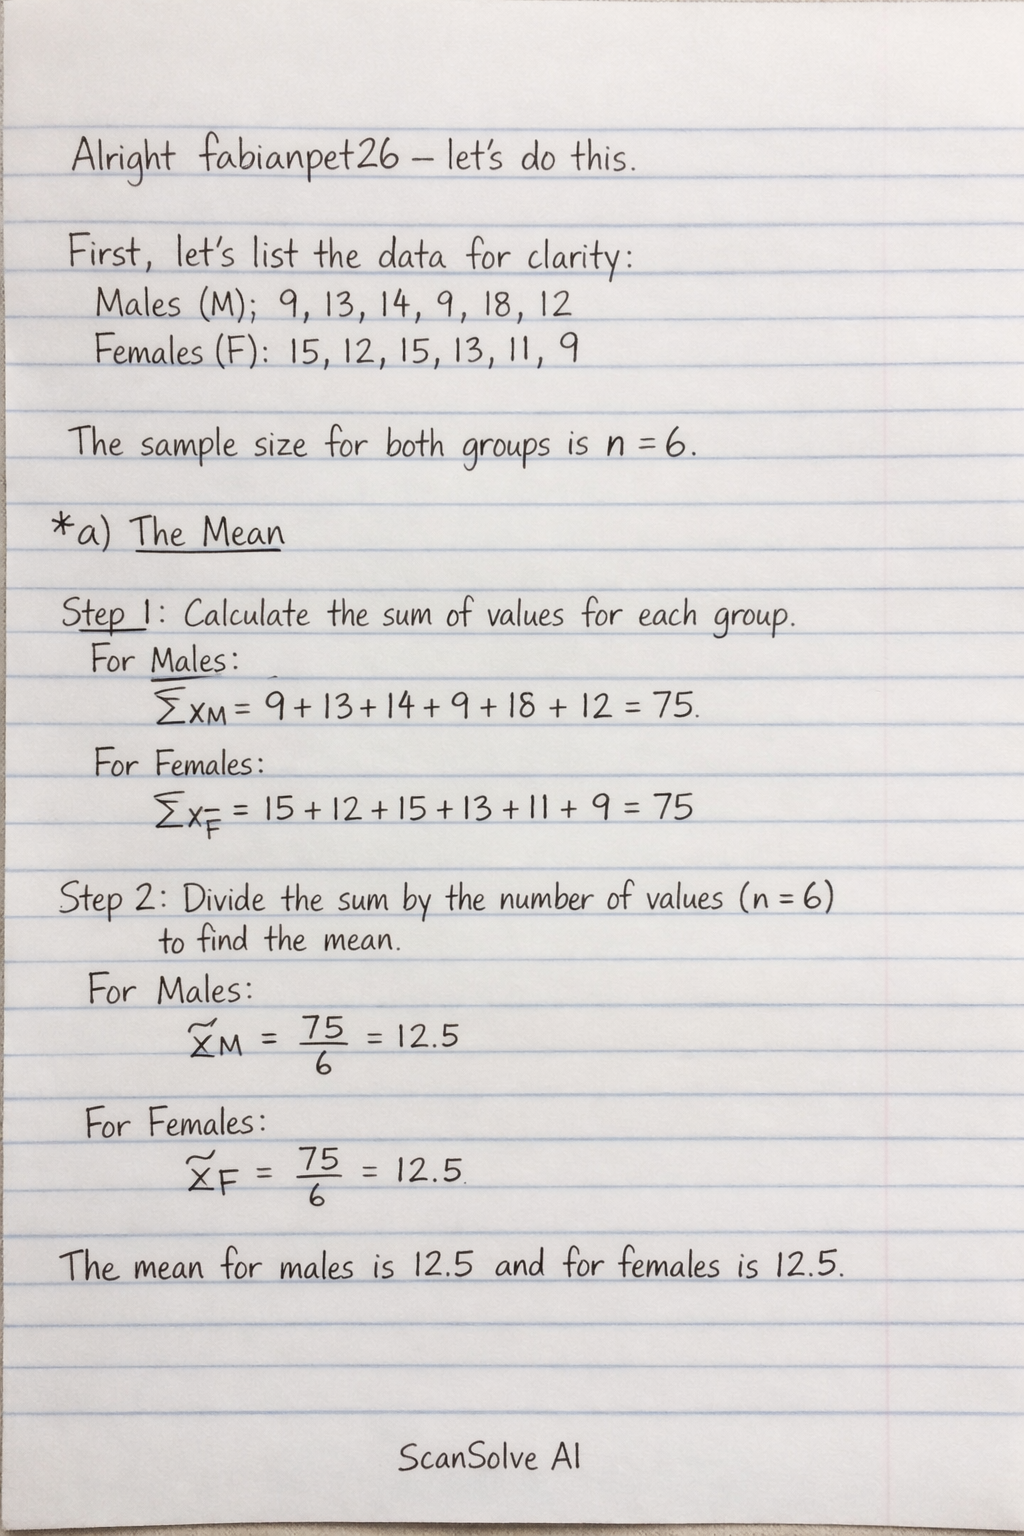
First, let's list the data for clarity: Males (M): 9, 13, 14, 9, 18, 12 Females (F): 15, 12, 15, 13, 11, 9 The sample size for both groups is n = 6. a) The Mean Step 1: Calculate the sum of values for each group. For Males: x_M = 9 + 13 + 14 + 9 + 18 + 12 = 75 For Females: x_F = 15 + 12 + 15 + 13 + 11 + 9 = 75 Step 2: Divide the sum by the number of values (n=6) to find the mean. For Males: x_M = (75)/(6) = 12.5 For Females: x_F = (75)/(6) = 12.5 The mean for males is 12.5 and for females is 12.5. b) The Median Step 1: Sort the data for each group in ascending order. For Males (sorted): 9, 9, 12, 13, 14, 18 For Females (sorted): 9, 11, 12, 13, 15, 15 Step 2: Since there are an even number of data points (n=6), the median is the average of the two middle values (the 3rd and 4th values). For Males: Median_M = (12 + 13)/(2) = (25)/(2) = 12.5 For Females: Median_F = (12 + 13)/(2) = (25)/(2) = 12.5 The median for males is 12.5 and for females is 12.5. c) The Mode Step 1: Identify the value that appears most frequently in each dataset. For Males: The value 9 appears twice. All other values appear once. For Females: The value 15 appears twice. All other values appear once. The mode for males is 9 and for females is 15. d) Standard Deviation We will calculate the sample standard deviation using the formula s = sqrt( (x_i - x))^2n-1. Step 1: Calculate the squared difference from the mean for each data point. For Males (x_M = 12.5): (9-12.5)^2 = (-3.5)^2 = 12.25 (13-12.5)^2 = (0.5)^2 = 0.25 (14-12.5)^2 = (1.5)^2 = 2.25 (9-12.5)^2 = (-3.5)^2 = 12.25 (18-12.5)^2 = (5.5)^2 = 30.25 (12-12.5)^2 = (-0.5)^2 = 0.25 Sum of squared differences for Males: 12.25 + 0.25 + 2.25 + 12.25 + 30.25 + 0.25 = 57.5 For Females (x_F = 12.5): (15-12.5)^2 = (2.5)^2 = 6.25 (12-12.5)^2 = (-0.5)^2 = 0.25 (15-12.5)^2 = (2.5)^2 = 6.25 (13-12.5)^2 = (0.5)^2 = 0.25 (11-12.5)^2 = (-1.5)^2 = 2.25 (9-12.5)^2 = (-3.5)^2 = 12.25 Sum of squared differences for Females: 6.25 + 0.25 + 6.25 + 0.25 + 2.25 + 12.25 = 27.5 Step 2: Calculate the variance (s^2) by dividing the sum of squared differences by (n-1). For Males: s_M^2 = (57.5)/(6-1) = (57.5)/(5) = 11.5 For Females: s_F^2 = (27.5)/(6-1) = (27.5)/(5) = 5.5 Step 3: Calculate the standard deviation (s) by taking the square root of the variance. For Males: s_M = sqrt(11.5) ≈ 3.391 For Females: s_F = sqrt(5.5) ≈ 2.345 The standard deviation for males is 3.391 and for females is 2.345. e) Analyze the data using independent t-test We will perform an independent samples t-test assuming equal variances (pooled t-test) since the sample sizes are equal. Step 1: State the hypotheses. Null Hypothesis (H_0): There is no significant difference between the mean attitude scores of males and females (_M = _F). Alternative Hypothesis (H_1): There is a significant difference between the mean attitude scores of males and females (_M ≠ _F). Step 2: Calculate the pooled variance (s_p^2). s_p^2 = ((n_M - 1)s_M^2 + (n_F - 1)s_F^2)/(n_M + n_F - 2) s_p^2 = ((6 - 1)(11.5) + (6 - 1)(5.5))/(6 + 6 - 2) s_p^2 = (5(11.5) + 5(5.5))/(10) s_p^2 = (57.5 + 27.5)/(10) = (85)/(10) = 8.5 Step 3: Calculate the t-statistic. t = (x_M - x_F)sqrt(s_p^2 ((1)/(n_M) + (1)/(n_F))) t = ((12.5 - 12.5))/(sqrt(8.5 (1)6) + (1)/(6)) t = (0)/(sqrt(8.5 (2)6)) t = (0)/(sqrt(8.5 (1)3)) = (0)/(sqrt(2.833...)) = 0 Step 4: Determine the degrees of freedom (df). df = n_M + n_F - 2 = 6 + 6 - 2 = 10 Step 5: Analyze the result. The calculated t-statistic is 0. Since the t-statistic is 0, this indicates that there is no observed difference between the sample means of males and females. A t-statistic of 0 means that the observed difference is exactly what would be expected if the null hypothesis were true. Therefore, we fail to reject the null hypothesis. There is no statistically significant difference in the attitude towards solid waste management between males and females based on this data. Send me the next one 📸