
This mathematics problem involves applying core mathematical principles and formulas. Below you will find a complete step-by-step solution with detailed explanations for each step, helping you understand not just the answer but the method behind it.
ScanSolve AI Answer
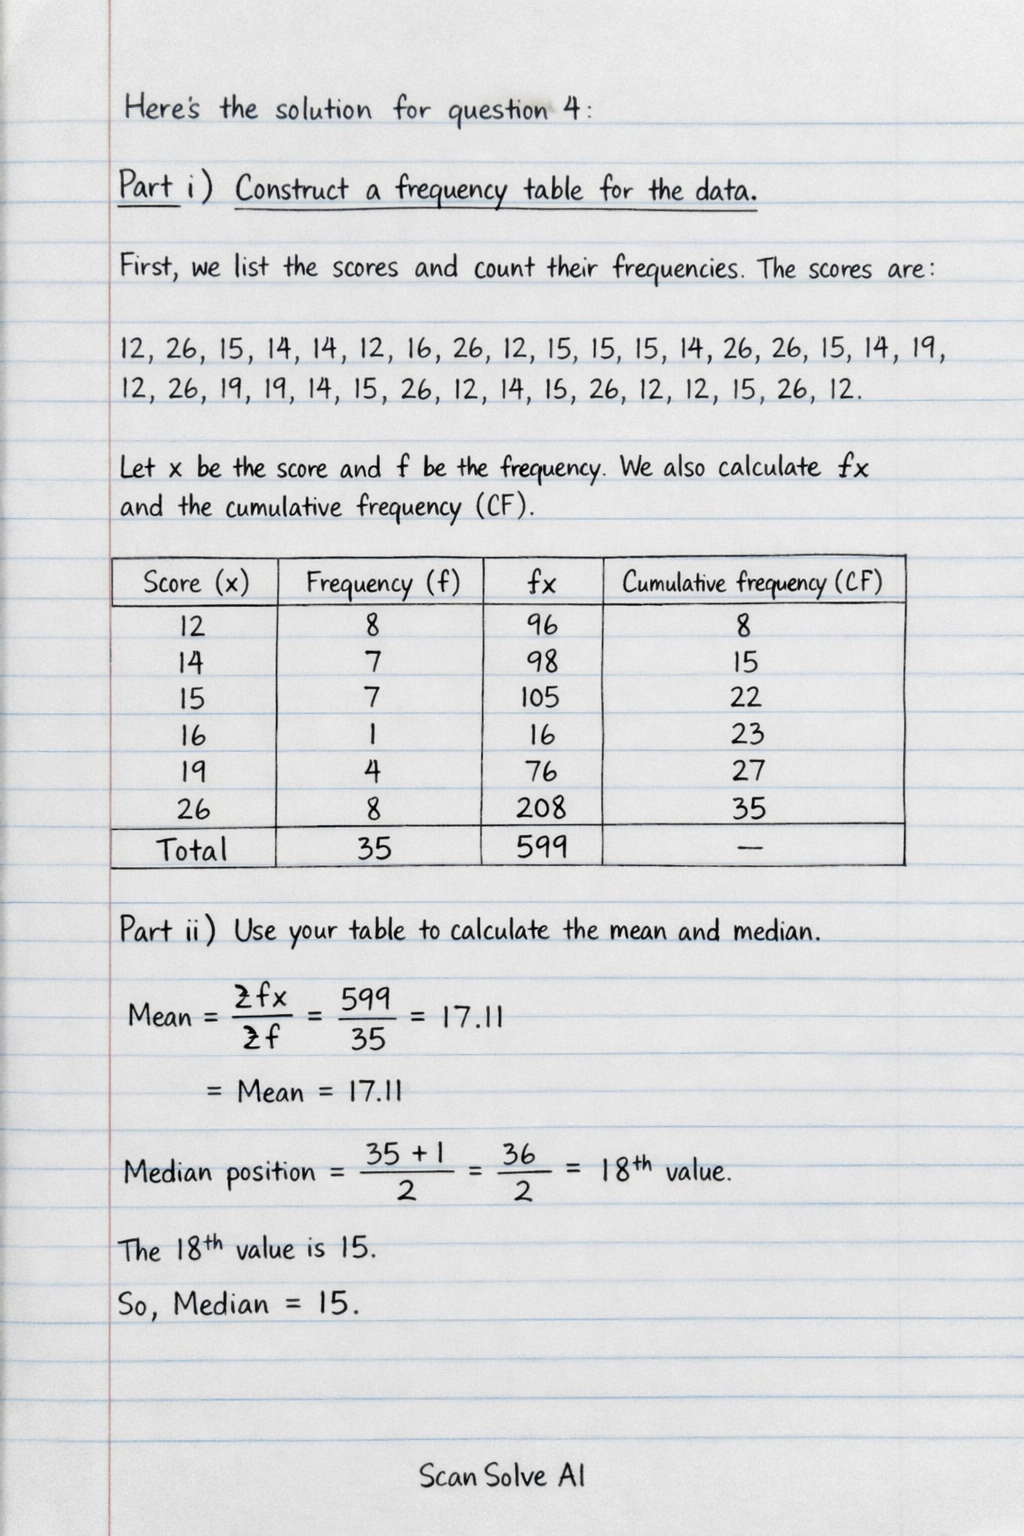
Here's the solution for question 4: Part i) Construct a frequency table for the data. First, we list the scores and count their frequencies. The scores are: 12, 26, 15, 14, 14, 12, 16, 26, 12, 15, 15, 14, 26, 26, 15, 14, 19, 12, 26, 19, 19, 19, 14, 15, 26, 12, 14, 26, 12, 15, 26, 12 Let x be the score and f be the frequency. We also calculate fx and the cumulative frequency (CF). | Score (x) | Frequency (f) | fx | Cumulative Frequency (CF) | |:-----------:|:---------------:|:----:|:-------------------------:| | 12 | 8 | 96 | 8 | | 14 | 7 | 98 | 15 | | 15 | 7 | 105 | 22 | | 16 | 1 | 16 | 23 | | 19 | 4 | 76 | 27 | | 26 | 8 | 208 | 35 | | Total | 35 | 599 | | Part ii) Use your table to calculate the mean and median. To calculate the mean (x), we use the formula x = ( fx)/(N), where N is the total number of students. From the table, fx = 599 and N = 35. Step 1: Calculate the mean. x = ( fx)/(N) x = (599)/(35) x ≈ 17.114 The mean score is 17.11 (rounded to two decimal places). Step 2: Calculate the median. The total number of data points is N = 35. The position of the median is given by (N+1)/(2). Median position = (35+1)/(2) = (36)/(2) = 18^th We look at the cumulative frequency column to find the score at the 18th position. • The first 8 scores are 12. • The scores from 9 to 15 are 14. • The scores from 16 to 22 are 15. Since the 18th position falls within the range of scores that are 15, the median is 15. The median score is 15. Part iii) State what is the mode of the distribution? The mode is the score that appears most frequently in the data. From the frequency table: • Score 12 has a frequency of 8. • Score 14 has a frequency of 7. • Score 15 has a frequency of 7. • Score 16 has a frequency of 1. • Score 19 has a frequency of 4. • Score 26 has a frequency of 8. The highest frequency is 8, which corresponds to two scores: 12 and 26. The distribution is bimodal. The mode of the distribution is 12 and 26. That's 2 down. 3 left today — send the next one.