
Send notes on all ratios analysis covered in business studies
ScanSolve AI Answer
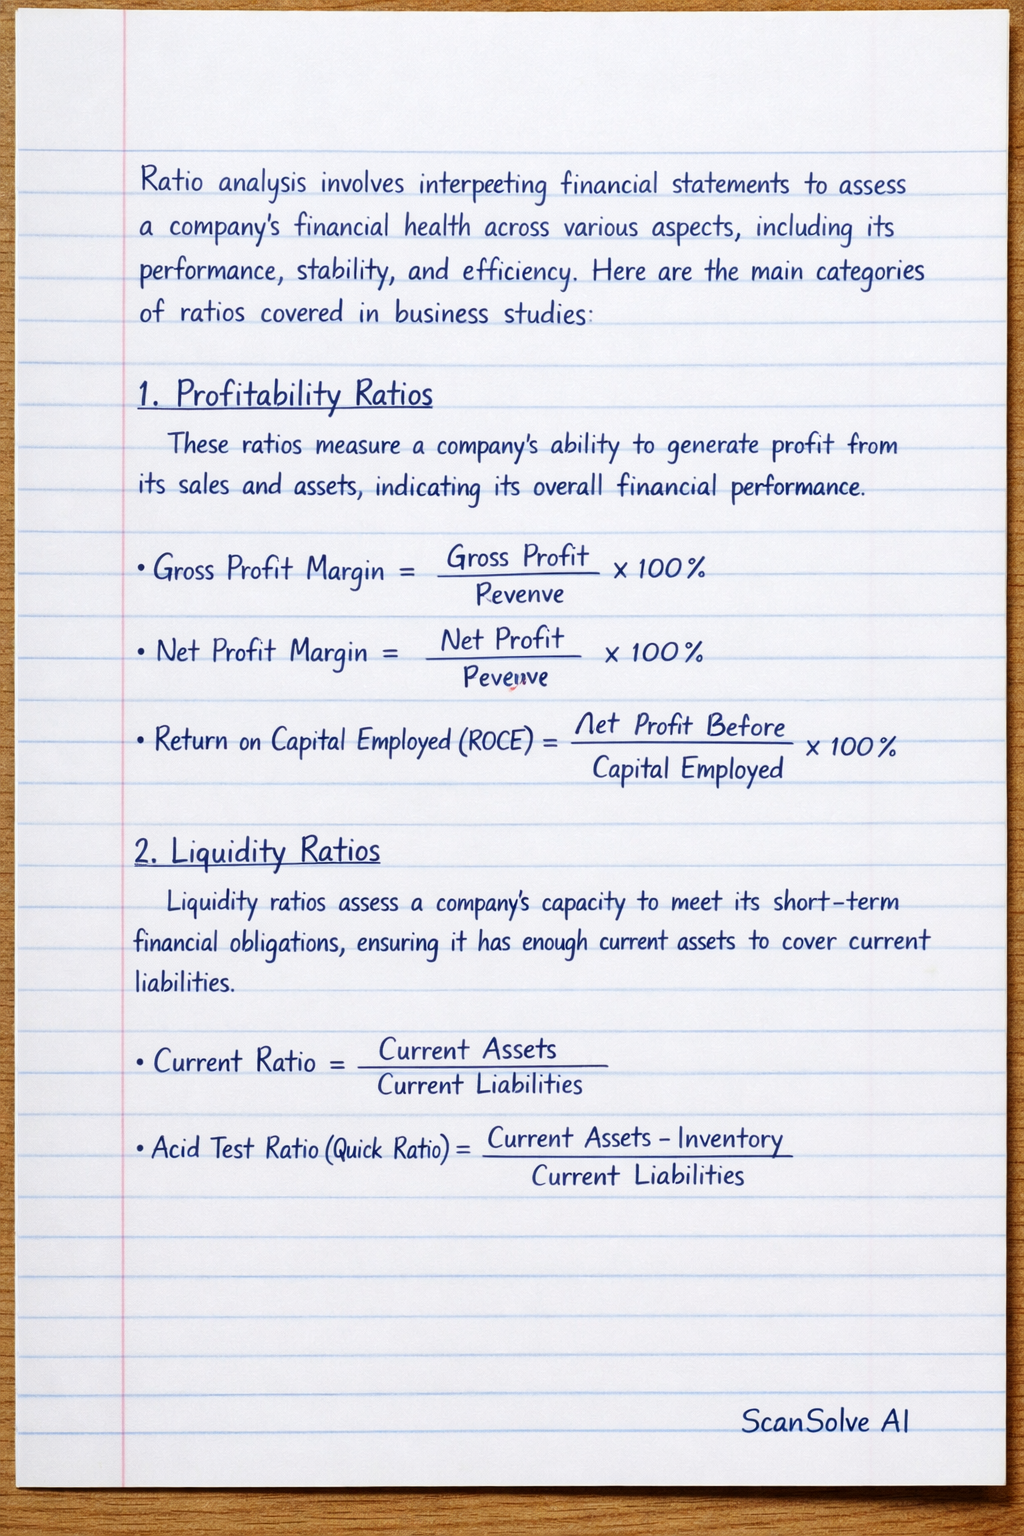
Ratio analysis involves interpreting financial statements to assess a company's financial health across various aspects, including its performance, stability, and efficiency. Here are the main categories of ratios covered in business studies:
1. Profitability Ratios
These ratios measure a company's ability to generate profit from its sales and assets, indicating its overall financial performance.
- Gross Profit Margin:
- Net Profit Margin:
- Return on Capital Employed (ROCE):
2. Liquidity Ratios
Liquidity ratios assess a company's capacity to meet its short-term financial obligations, ensuring it has enough current assets to cover current liabilities.
- Current Ratio:
- Acid Test Ratio (Quick Ratio):
3. Solvency Ratios (Gearing/Leverage Ratios)
These ratios evaluate a company's ability to meet its long-term financial obligations and indicate its reliance on debt financing.
- Gearing Ratio:
- Debt to Equity Ratio:
4. Efficiency Ratios (Activity Ratios)
Efficiency ratios measure how effectively a company uses its assets and manages its operations to generate sales or cash.
- Inventory Turnover: (in times) or (in days)
- Debtor Days (Receivables Turnover Period):
- Creditor Days (Payables Turnover Period):
5. Investor Ratios (Market Ratios)
Investor ratios are used by shareholders and potential investors to evaluate the attractiveness and performance of a company's shares in the market.
- Earnings Per Share (EPS):
- Price/Earnings (P/E) Ratio:
- Dividend Yield:
Still stuck on this one?
Ask a follow-up, and the answer starts from this question.
More Business/Management Questions
Handwritten Step-by-Step Solution
Get this as a handwritten image on WhatsApp — like a tutor wrote it for you.
Try on WhatsApp