
We read your photo as:
Explain the three categories of Quality Control and differentiate between efficiency and sufficiency properties of a good estimator
ScanSolve AI Answer
Step-by-step solution
6 stepsHere's the solution to your questions:
5(a) Explain the three categories of Quality Control?
The three main categories of Quality Control are:
- Acceptance Sampling: This involves inspecting a sample of products from a larger batch (lot) to decide whether to accept or reject the entire lot. It's used for incoming materials, in-process goods, or final products.
- Process Control: Also known as Statistical Process Control (SPC), this category focuses on monitoring a production process while it is happening. It uses tools like control charts to detect variations and ensure the process remains stable and within desired limits, preventing defects.
- Measurement System Analysis (MSA): This category involves evaluating the quality and reliability of the measurement system itself. It ensures that the data collected for quality control is accurate and precise, as faulty measurements can lead to incorrect decisions about product quality or process stability.
5(b) Differentiate between efficiency and sufficiency properties of a good estimator
- Efficiency: An estimator is considered efficient if it has the smallest possible variance among all unbiased estimators. This means that, on average, the estimates produced by an efficient estimator will be closer to the true population parameter compared to other unbiased estimators, making it more precise.
- Sufficiency: An estimator is sufficient if it captures all the information about the population parameter that is contained in the sample data. In other words, no other estimator could extract more information from the sample about the parameter than a sufficient estimator.
5(c) Hypothesis test for the mean volume of soft drink
State the Hypotheses
The null hypothesis () states that the mean volume is 200 ml. The alternative hypothesis () states that the mean volume is less than 200 ml.
Choose the Test Statistic
Since the population standard deviation () is known and the sample size () is large, we use a z-test for the mean.
The formula for the z-test statistic is:Calculate the Test Statistic
Given:
Sample mean () = 198 ml
Hypothesized population mean () = 200 ml
Population standard deviation () = 10 ml
Sample size () = 50Determine the Critical Value
For a one-tailed (left-tailed) test at a 5% level of significance (), the critical z-value is found from the standard normal distribution table.
Make a Decision
Compare the calculated Z-statistic with the critical Z-value.
Calculated
Critical
Since , the calculated Z-statistic does not fall into the rejection region. Therefore, we fail to reject the null hypothesis.State the Conclusion
There is not enough evidence at the 5% level of significance to conclude that the mean volume of soft drink per bottle is less than 200 ml.
Still stuck on this one?
Ask a follow-up, and the answer starts from this question.
More Business/Management Questions
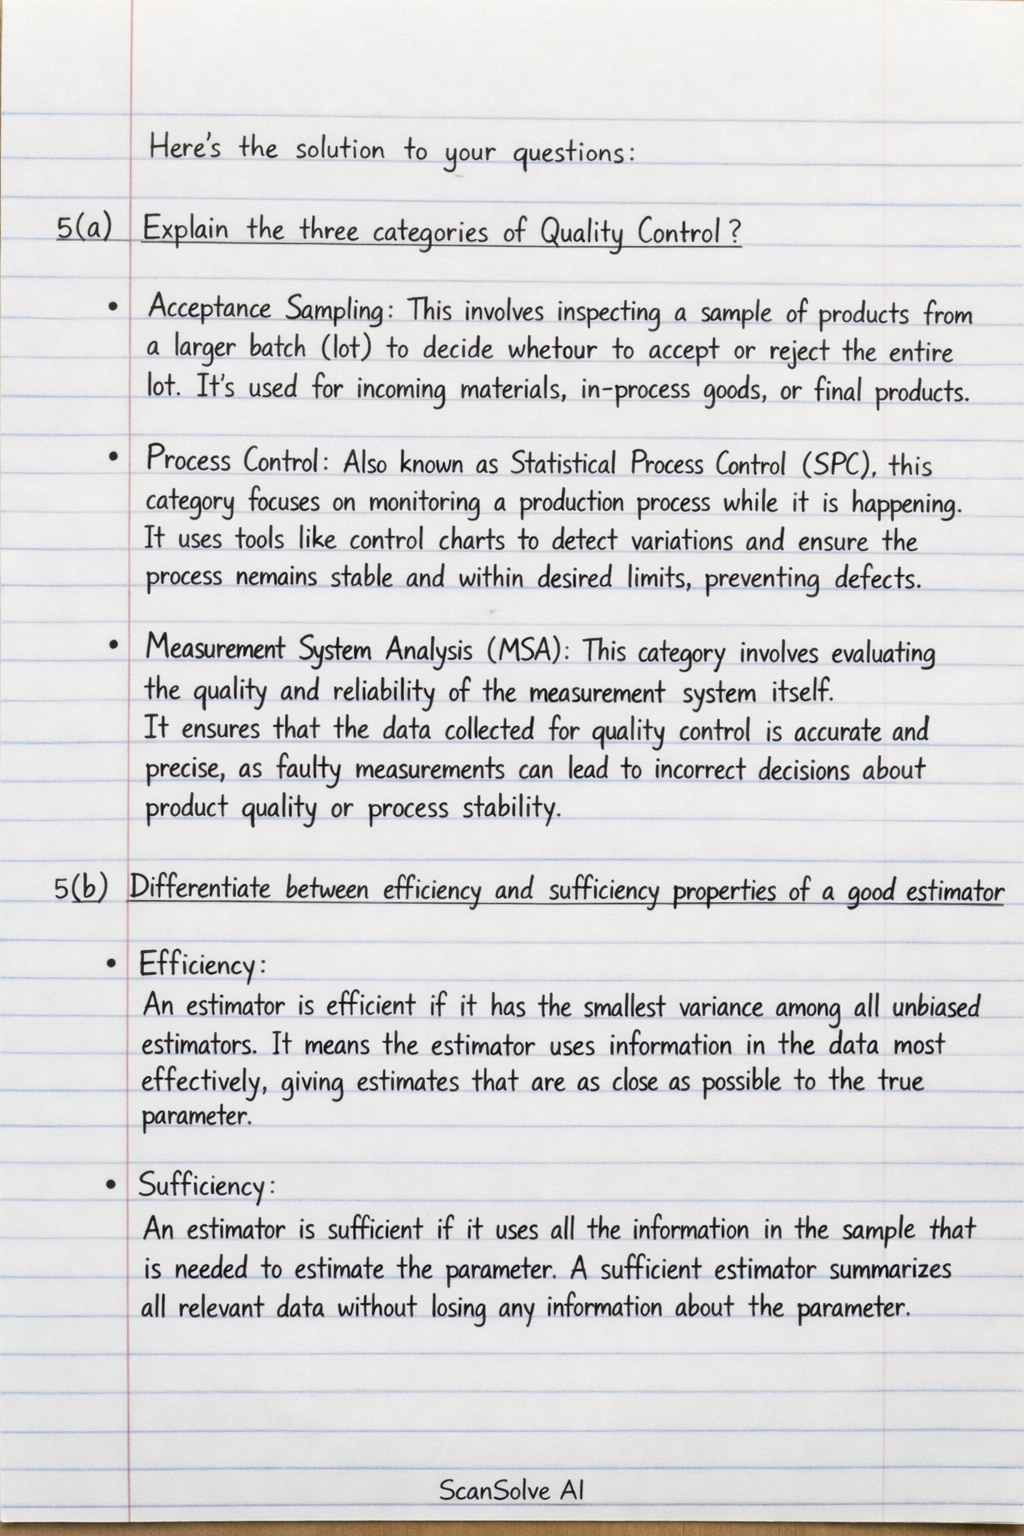
Handwritten Step-by-Step Solution
Get this as a handwritten image on WhatsApp — like a tutor wrote it for you.
Try on WhatsApp