

This computer science problem involves algorithmic thinking and programming concepts. The solution below explains the approach, logic, and implementation step by step.
ScanSolve AI Answer
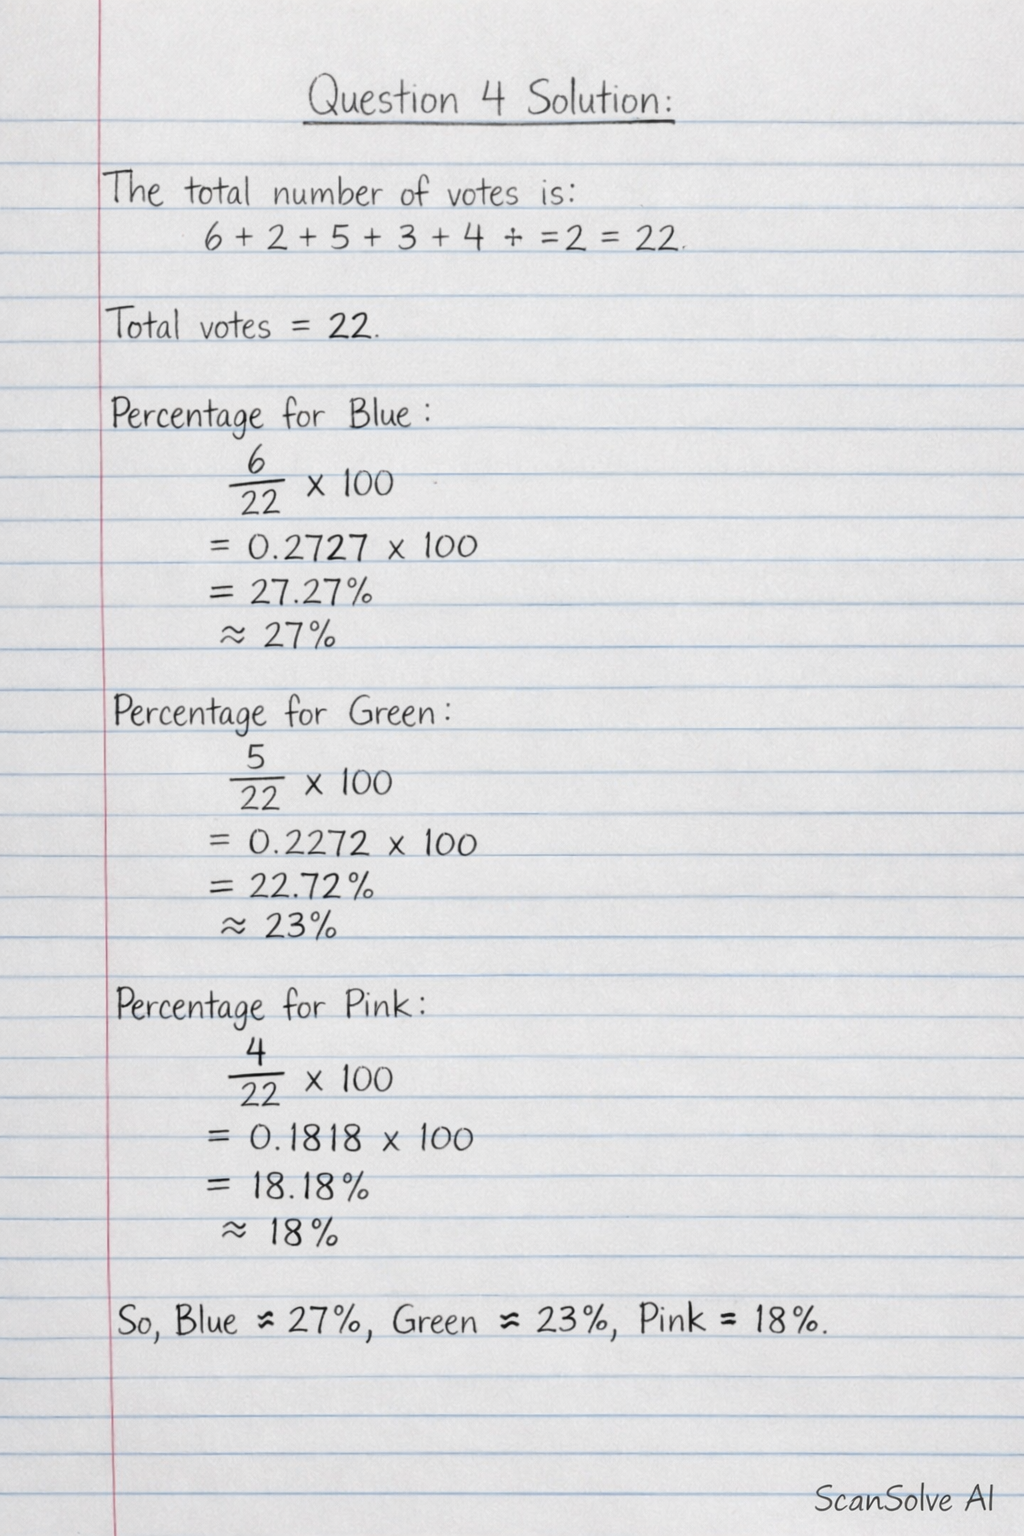
Question 3 The features of the visual text (bar graph) are: • Title: "Favourite Colours Bar Graph - Reading a Bar Graph" • Axes: A horizontal axis labeled "Color" displaying categories (Blue, Brown, Green, Orange, Pink, Purple) and a vertical axis labeled "of Votes" displaying numerical frequency. • Scale: The vertical axis has a numerical scale from 0 to 6, representing the number of votes. • Bars: Rectangular bars of varying heights, where each bar corresponds to a specific color category. • Data Representation: The height of each bar visually represents the number of votes received for that particular color. • Description: The text below the graph clarifies its purpose: "The diagram shows the number of people who voted for different colours." Question 4 This question requires you to collect an external article or story and attach it to your Portfolio of Evidence (POE) before answering the sub-questions. As an AI, I cannot access external documents or provide a specific article for analysis. Therefore, I cannot complete this question. Question 5 As an AI, I cannot physically perform the action of drawing. However, the instruction "Draw a rectangle" translates into the action of creating a closed two-dimensional shape with four straight sides, where opposite sides are parallel and equal in length, and all four internal angles are right angles (90 degrees).