
This economics question tests your understanding of economic models and analysis. The step-by-step answer below applies the relevant framework and explains the reasoning.
ScanSolve AI Answer
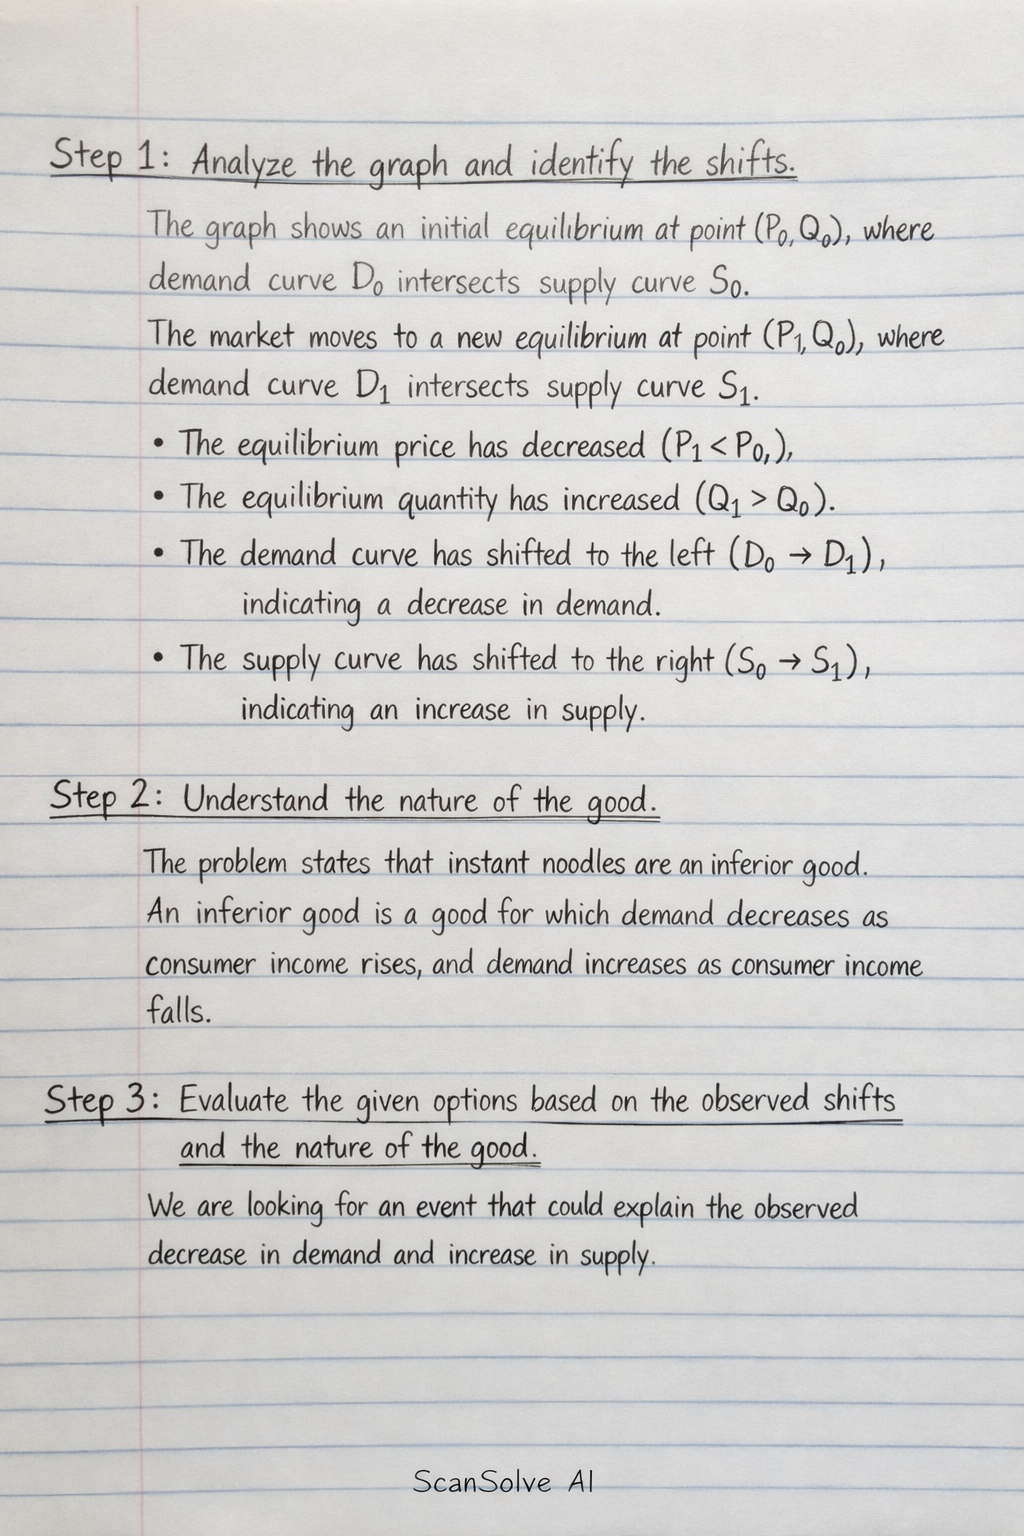
Step 1: Analyze the graph and identify the shifts. The graph shows an initial equilibrium at point (P_0, Q_0), where demand curve D_0 intersects supply curve S_0. The market moves to a new equilibrium at point (P_1, Q_1), where demand curve D_1 intersects supply curve S_1. From the graph: • The equilibrium price has decreased (P_1 < P_0). • The equilibrium quantity has increased (Q_1 > Q_0). • The demand curve has shifted to the left (D_0 D_1), indicating a decrease in demand. • The supply curve has shifted to the right (S_0 S_1), indicating an increase in supply. Step 2: Understand the nature of the good. The problem states that instant noodles are an inferior good. An inferior good is a good for which demand decreases as consumer income rises, and demand increases as consumer income falls. Step 3: Evaluate the given options based on the observed shifts and the nature of the good. We are looking for an event that could explain the observed decrease in demand and increase in supply. a) an increase in the price of a complement: An increase in the price of a complementary good would lead to a decrease in demand for instant noodles (leftward shift of the demand curve). This matches the observed demand shift. However, this option does not explain the increase in supply. b) an increase in buyers' income: Since instant noodles are an inferior good, an increase in buyers' income would cause a decrease in demand* for instant noodles (leftward shift of the demand curve, D_0 D_1). This perfectly matches the observed demand shift. This option does not explain the increase in supply. c) a decrease in the buyers' income: For an inferior good, a decrease in buyers' income would lead to an increase in demand* (rightward shift of the demand curve). This contradicts the observed leftward shift of the demand curve. d) an increase in the price of the good: A change in the price of the good itself causes a movement along* the demand and supply curves, not a shift of the entire curves. This option is incorrect. Step 4: Conclude the most accurate explanation. Both options (a) and (b) could explain the decrease in demand. However, the problem explicitly states that instant noodles are an inferior good. This specific characteristic directly links changes in income to changes in demand. Therefore, an increase in buyers' income is the most direct and relevant explanation for the observed decrease in demand for instant noodles. While the options do not provide a cause for the supply shift, option (b) correctly explains the demand component of the market movement based on the given information about the good. The final answer is b). 3 done, 2 left today. You're making progress.