
This economics question tests your understanding of economic models and analysis. The step-by-step answer below applies the relevant framework and explains the reasoning.
ScanSolve AI Answer
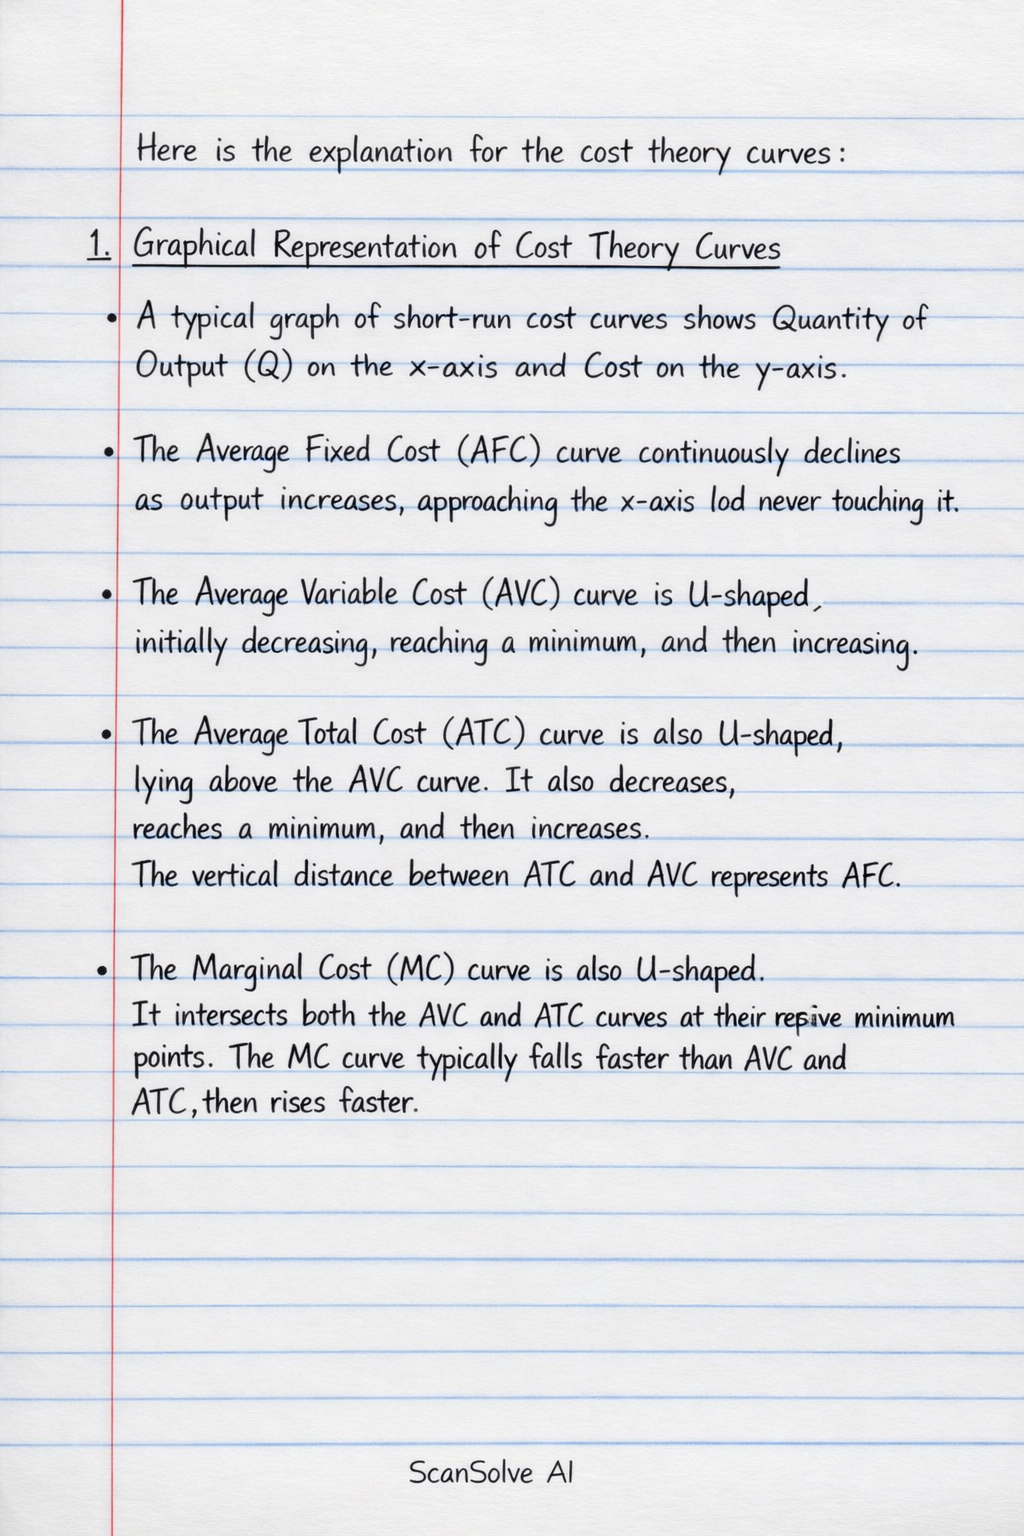
Here is the explanation for the cost theory curves: 1. Graphical Representation of Cost Theory Curves A typical graph of short-run cost curves shows Quantity of Output (Q) on the x-axis and Cost on the y-axis. The Average Fixed Cost (AFC) curve continuously declines as output increases, approaching the x-axis but never touching it. The Average Variable Cost (AVC) curve is U-shaped, initially decreasing, reaching a minimum, and then increasing. The Average Total Cost (ATC) curve is also U-shaped, lying above the AVC curve. It also decreases, reaches a minimum, and then increases. The vertical distance between ATC and AVC represents AFC. The Marginal Cost (MC) curve is also U-shaped. It intersects both the AVC and ATC curves at their respective minimum points. The MC curve typically falls faster than AVC and ATC, then rises faster. Here's a description of their typical relationship: When MC is below AVC, AVC is falling. When MC is above AVC, AVC is rising. When MC is below ATC, ATC is falling. When MC is above ATC, ATC is rising. MC intersects AVC and ATC at their lowest points. 2. Explanation of Each Cost Curve and One Assumption Marginal Cost (MC) Curve Explanation: Marginal cost is the additional cost incurred by producing one more unit of output. It measures the change in total cost resulting from a one-unit change in the quantity of output. Assumption: Diminishing marginal returns* eventually set in, meaning that beyond a certain point, each additional unit of input contributes less to output, causing the cost of producing an additional unit to rise. Average Cost (AC) Curve (often refers to Average Total Cost, ATC) Explanation: Average Cost (or Average Total Cost, ATC) is the total cost of production divided by the total quantity of output produced. It represents the per-unit cost of production. Assumption: Production occurs in the short run*, where at least one input (e.g., capital) is fixed, leading to the U-shaped curve due to the interplay of spreading fixed costs and diminishing returns. Average Total Cost (ATC) Curve Explanation: Average Total Cost (ATC) is the sum of Average Fixed Cost (AFC) and Average Variable Cost (AVC). It represents the total cost per unit of output. Assumption: All costs are considered*, including both fixed and variable costs, when calculating the per-unit cost of production. Average Fixed Cost (AFC) Curve Explanation: Average Fixed Cost (AFC) is the total fixed cost divided by the total quantity of output produced. Fixed costs do not change with the level of output in the short run. Assumption: Fixed costs are constant* regardless of the level of output (within a relevant range), meaning they do not vary with production volume.