
We read your photo as:
Draw a Production Possibility Curve (PPC) for Rice and Corn given the following data points. Label the axes and plot the points. What is the name of the curve and what is its shape? State two assumpti
ScanSolve AI Answer
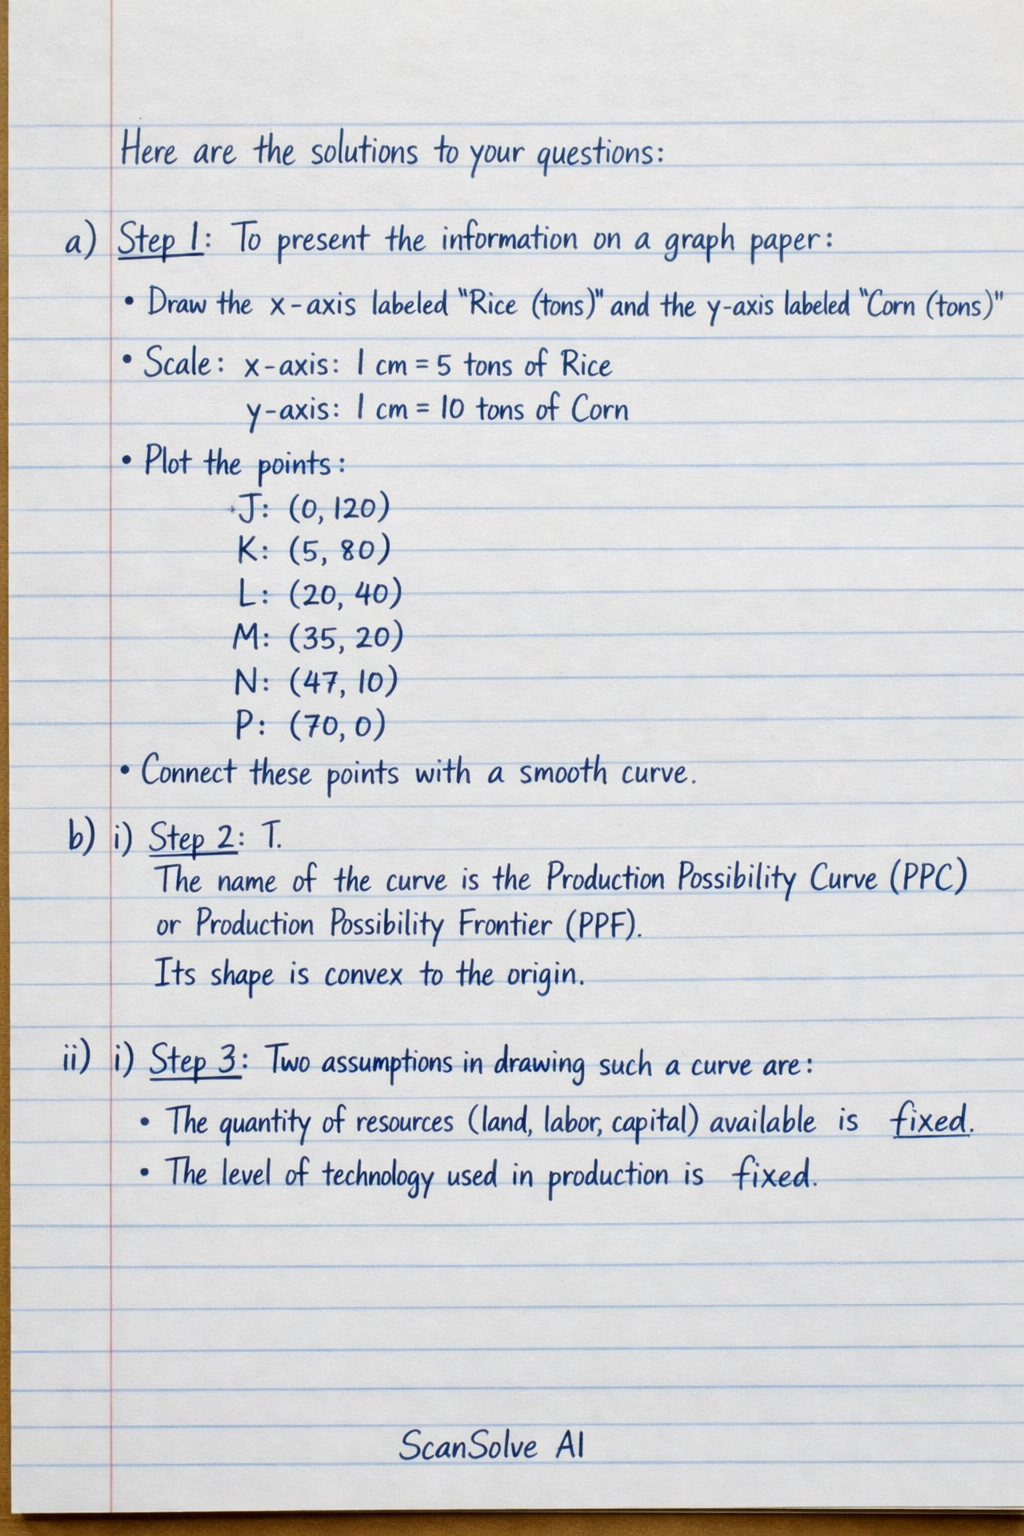
Here are the solutions to your questions:
a) Step 1: To present the information on a graph paper:
- Draw a horizontal axis (x-axis) labeled "Rice (tons)" and a vertical axis (y-axis) labeled "Corn (tons)".
- For the horizontal axis, use a scale where represents of Rice.
- For the vertical axis, use a scale where represents of Corn.
- Plot the following points:
- J:
- K:
- L:
- M:
- N:
- P:
- Connect these points with a smooth curve.
b) i) Step 2: The name of the curve is the Production Possibility Curve (PPC) or Production Possibility Frontier (PPF). Its shape is convex to the origin.
ii) Step 3: Two assumptions in drawing such a curve are:
- The quantity of resources (land, labor, capital) available is fixed.
- The level of technology used in production is fixed.
c) Step 4: To calculate the opportunity cost of of Rice in terms of Corn:
- From J to K: Gain of Rice, lose of Corn. Opportunity cost of of Rice .
- From K to L: Gain of Rice, lose of Corn. Opportunity cost of of Rice .
- From L to M: Gain of Rice, lose of Corn. Opportunity cost of of Rice .
- From M to N: Gain of Rice, lose of Corn. Opportunity cost of of Rice .
- From N to P: Gain of Rice, lose of Corn. Opportunity cost of of Rice .
Observation: The opportunity cost of producing of Rice decreases as more Rice is produced.
d) Step 5: The technical terms for the combinations are:
i. of Rice and of Corn: Inefficient production or Underutilization of resources.
ii. of Rice and of Corn: Efficient production or Full employment of resources.
e) Step 6: Four factors that can cause the curve drawn in a) to shift inwards are:
- A decrease in the quantity of available resources (e.g., a decline in the labor force or destruction of land).
- A decrease in the quality of resources (e.g., soil degradation or less educated workforce).
- Technological regression or a decline in production methods.
- Natural disasters or widespread conflict that destroy productive capacity.
Still stuck on this one?
Ask a follow-up, and the answer starts from this question.
More Economics Questions
Handwritten Step-by-Step Solution
Get this as a handwritten image on WhatsApp — like a tutor wrote it for you.
Try on WhatsApp